

How Many Hours a Week Do Europeans Work?
Concept · Data Storytelling · Design
2026
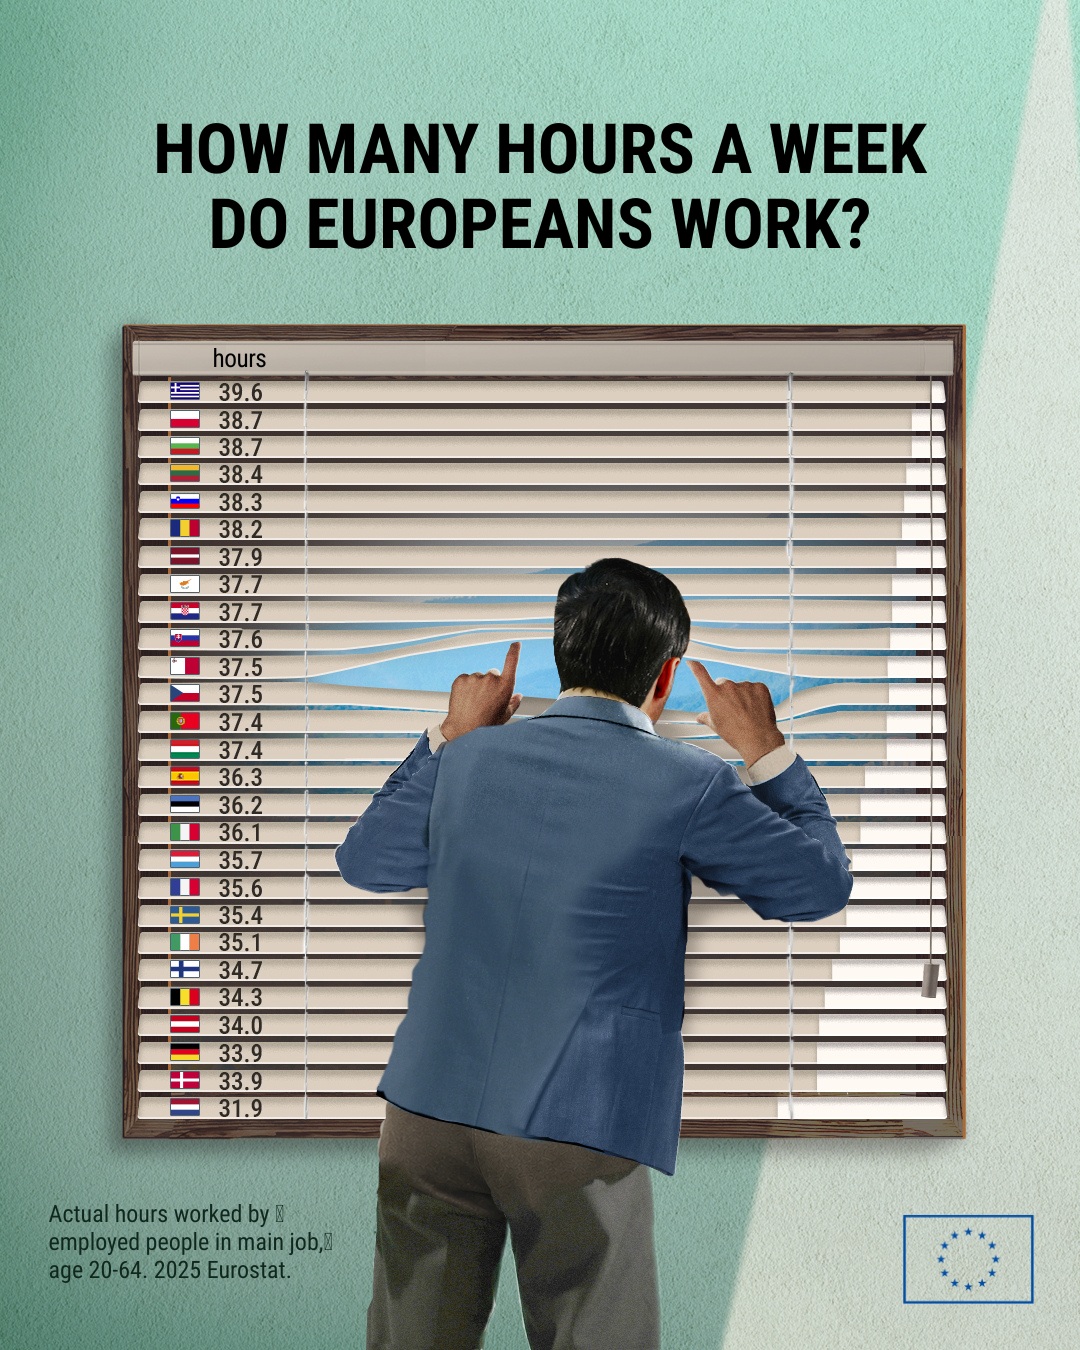
Opening the curtains captures a familiar moment in a long working day: looking outside and waiting for the day to move on.
View original postMore Data Storytelling

Concept · Data Storytelling · Design
2026
Opening the curtains captures a familiar moment in a long working day: looking outside and waiting for the day to move on.
View original postData Storytelling · Design
2026
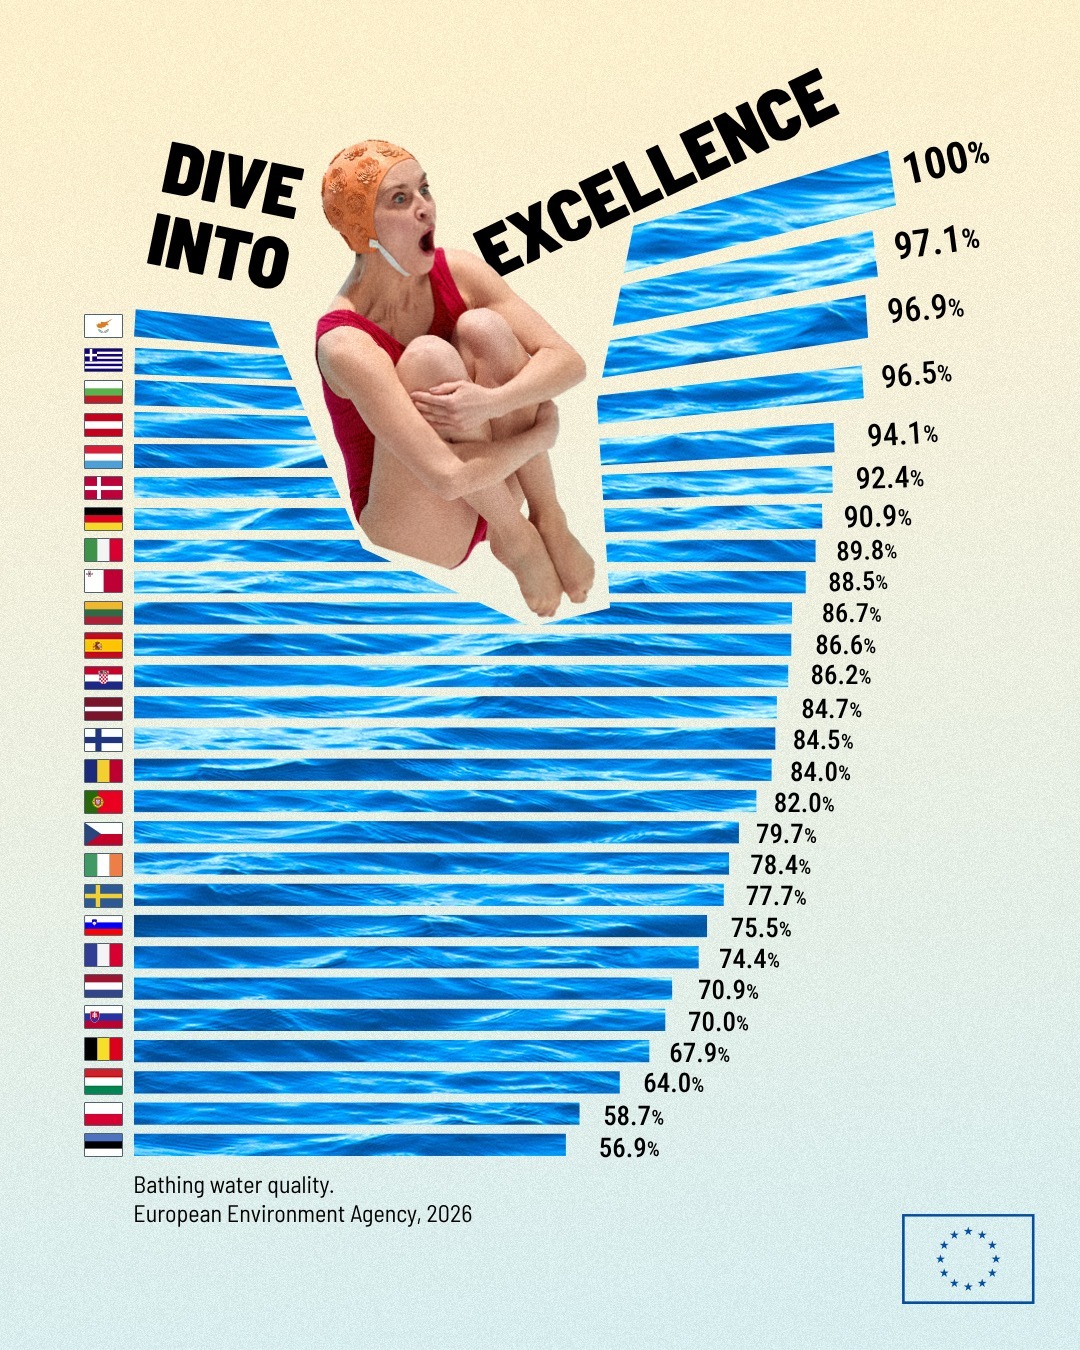
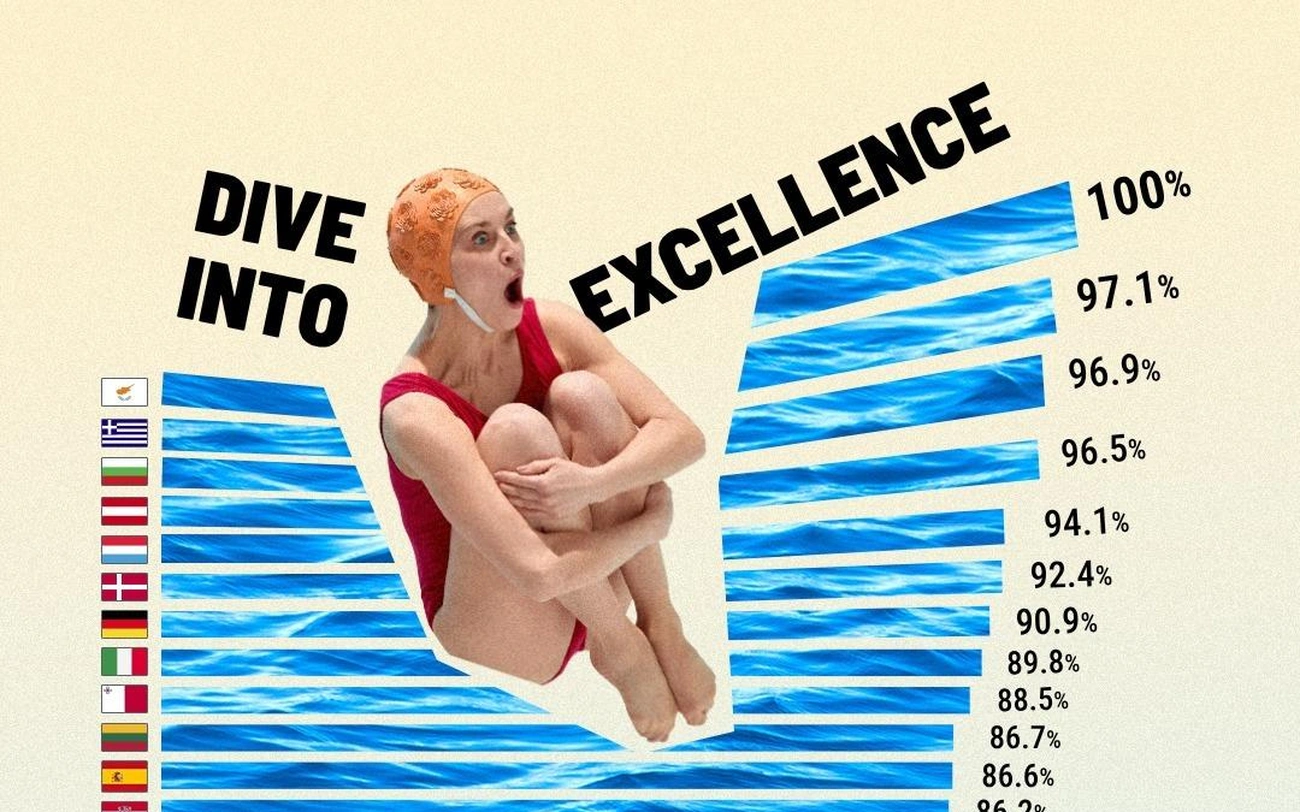
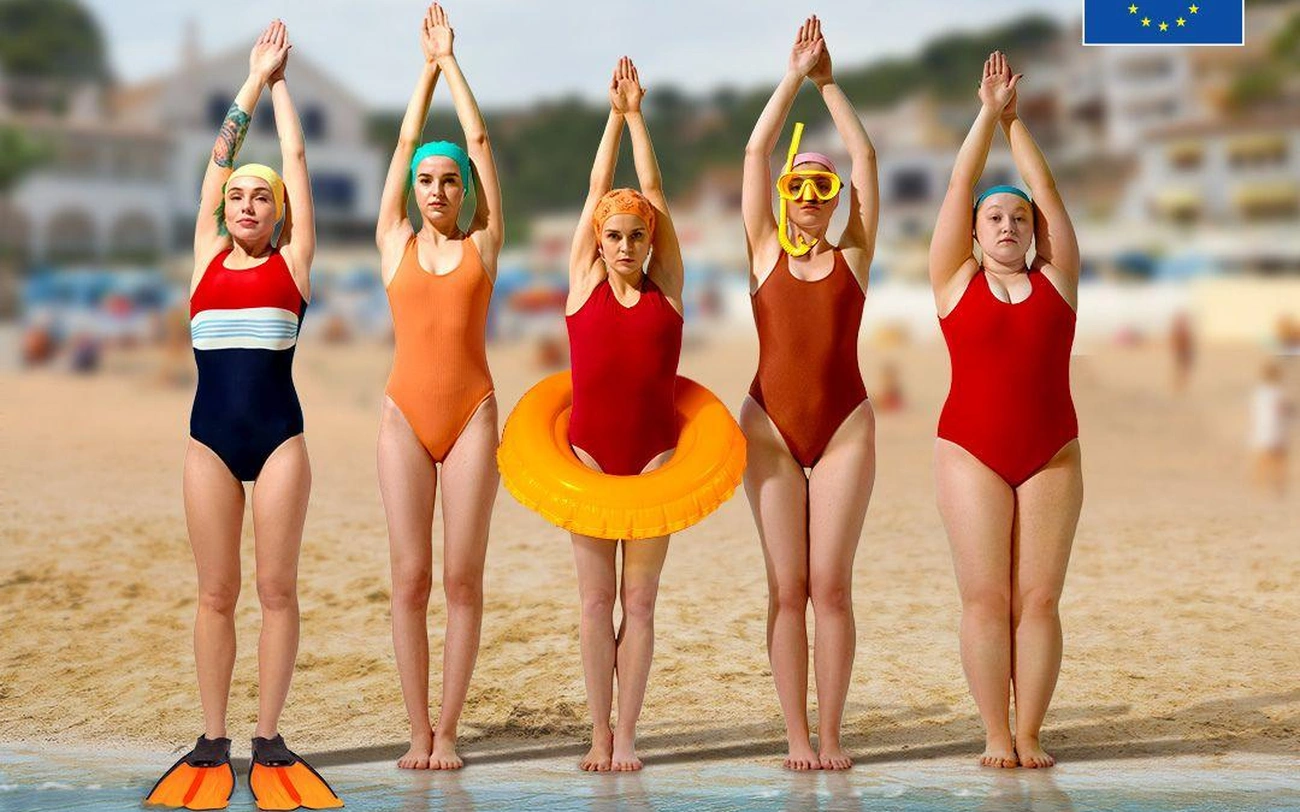
Rigorous bathing-water data becomes an unexpectedly playful chart. A swimmer and disrupted typography break its conventions while keeping the strong scores and 100% values immediately legible, making positive results memorable without compromising accuracy.
View original postData Storytelling · Design
2026
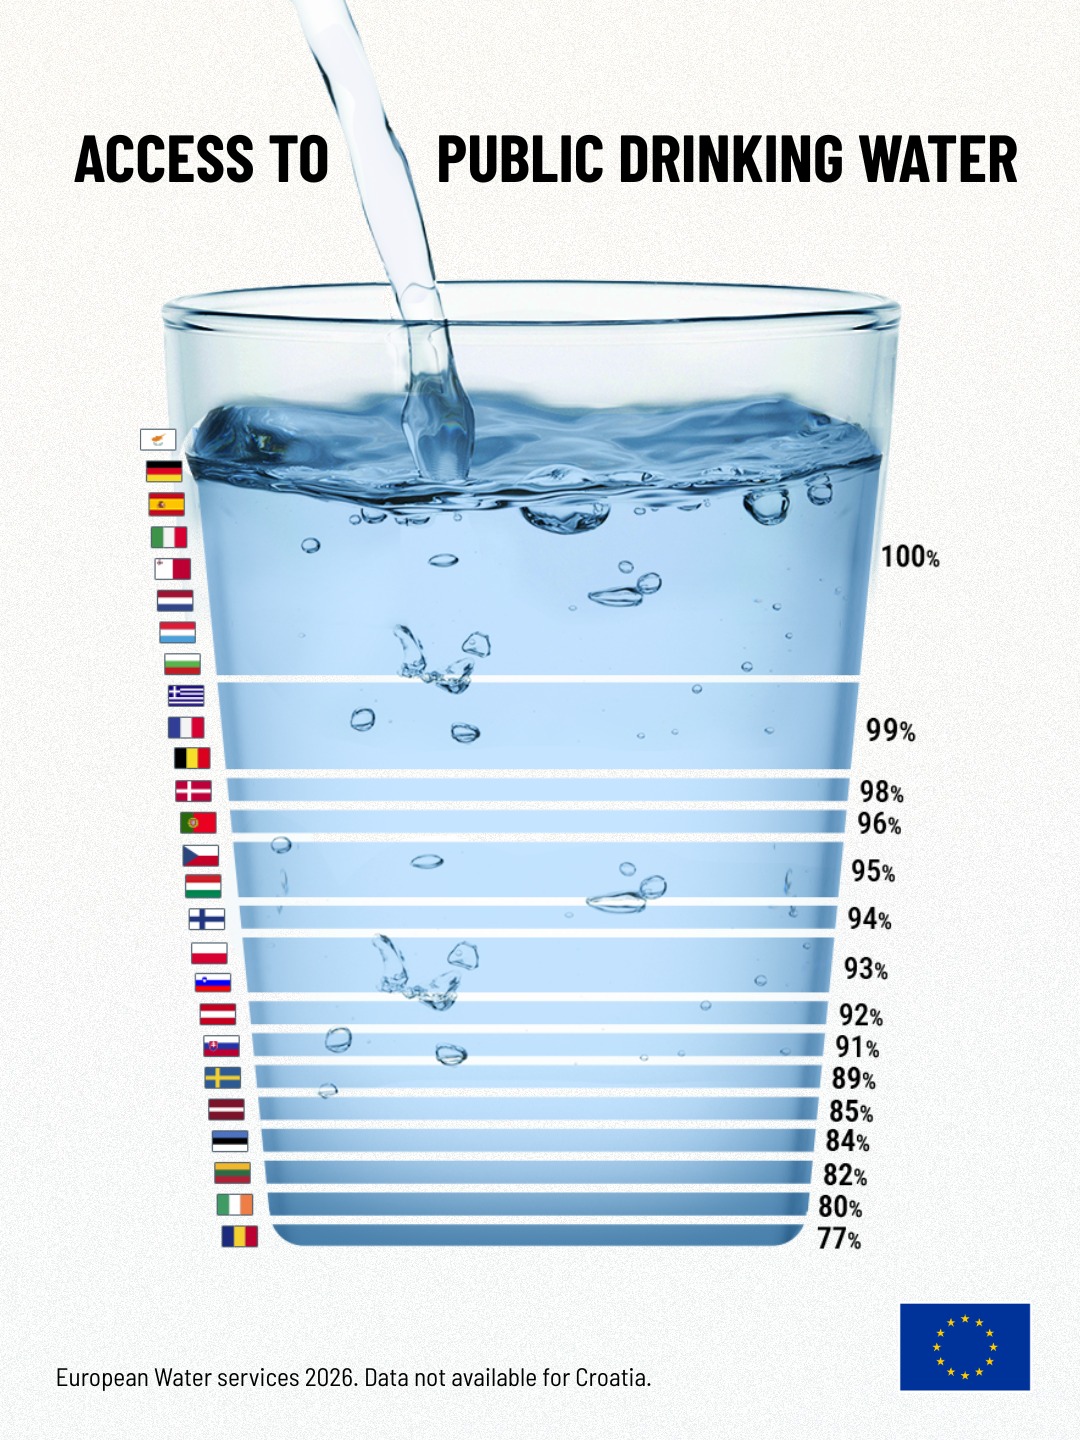
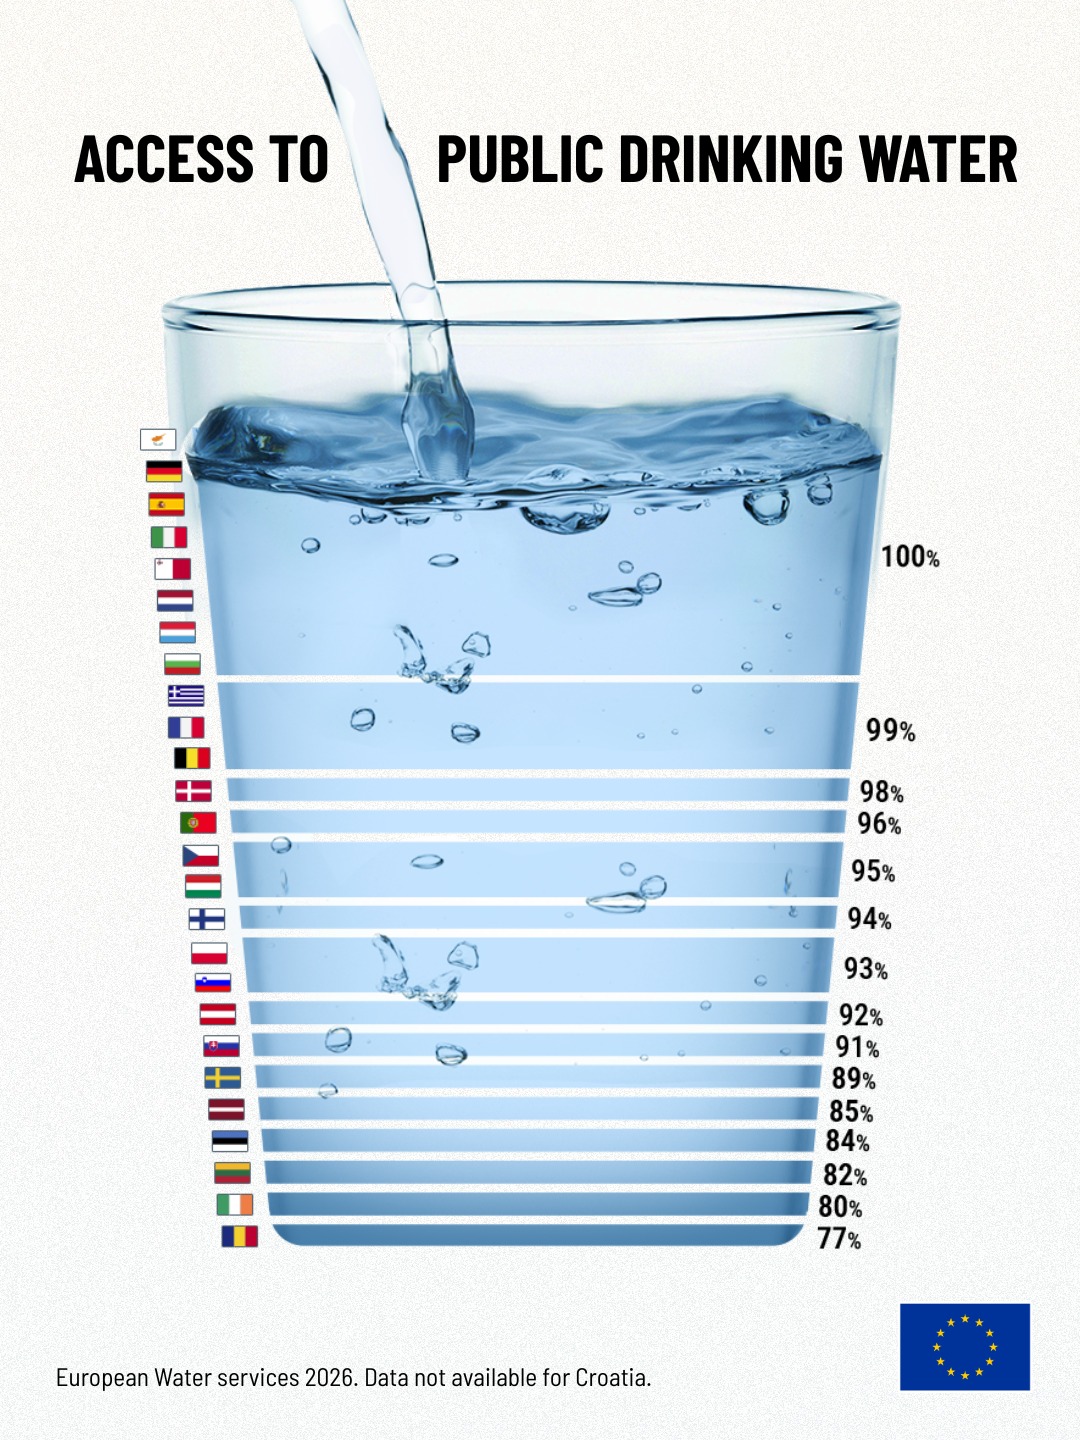
A country comparison designed to make relatively small differences in access visible, highlighting that high percentages can still conceal meaningful gaps in a basic public service.
View original postEUDataCrunch project
Concept · Copy · Data Storytelling · Design
2023
View original postEUDataCrunch project
Concept · Copy · Data Storytelling · Design · Animation
2024
View original postEUDataCrunch project
Concept · Copy · Data Storytelling · Design
2021
View original postEUDataCrunch project
Concept · Copy · Data Storytelling · Design
2021
View original postEUDataCrunch project
Data Storytelling · Design
2021
View original postEUDataCrunch project
Concept · Copy · Data Storytelling · Design
2022
View original postEUDataCrunch project
Concept · Copy · Data Storytelling · Design
2022
View original postEUDataCrunch project
Concept · Copy · Data Storytelling · Design
2022
View original postEUDataCrunch project
Concept · Copy · Data Storytelling · Design
2022
View original postEUDataCrunch project
Concept · Copy · Data Storytelling · Design
2023
View original postEUDataCrunch project
Concept · Copy · Data Storytelling · Design · Storyboarding
2023
Translating a complex carbon-pricing mechanism into a visual sequence, connecting EU ETS revenues with clean-tech investment, projected avoided CO₂e and a final real-world emissions equivalence.
View original postEUDataCrunch project
Concept · Copy · Data Storytelling · Design
2021
View original postEUDataCrunch project
Data Storytelling · Design
2021
View original postEUDataCrunch project
Data Storytelling · Design
2021
View original postEUDataCrunch project
Data Storytelling · Design
2021
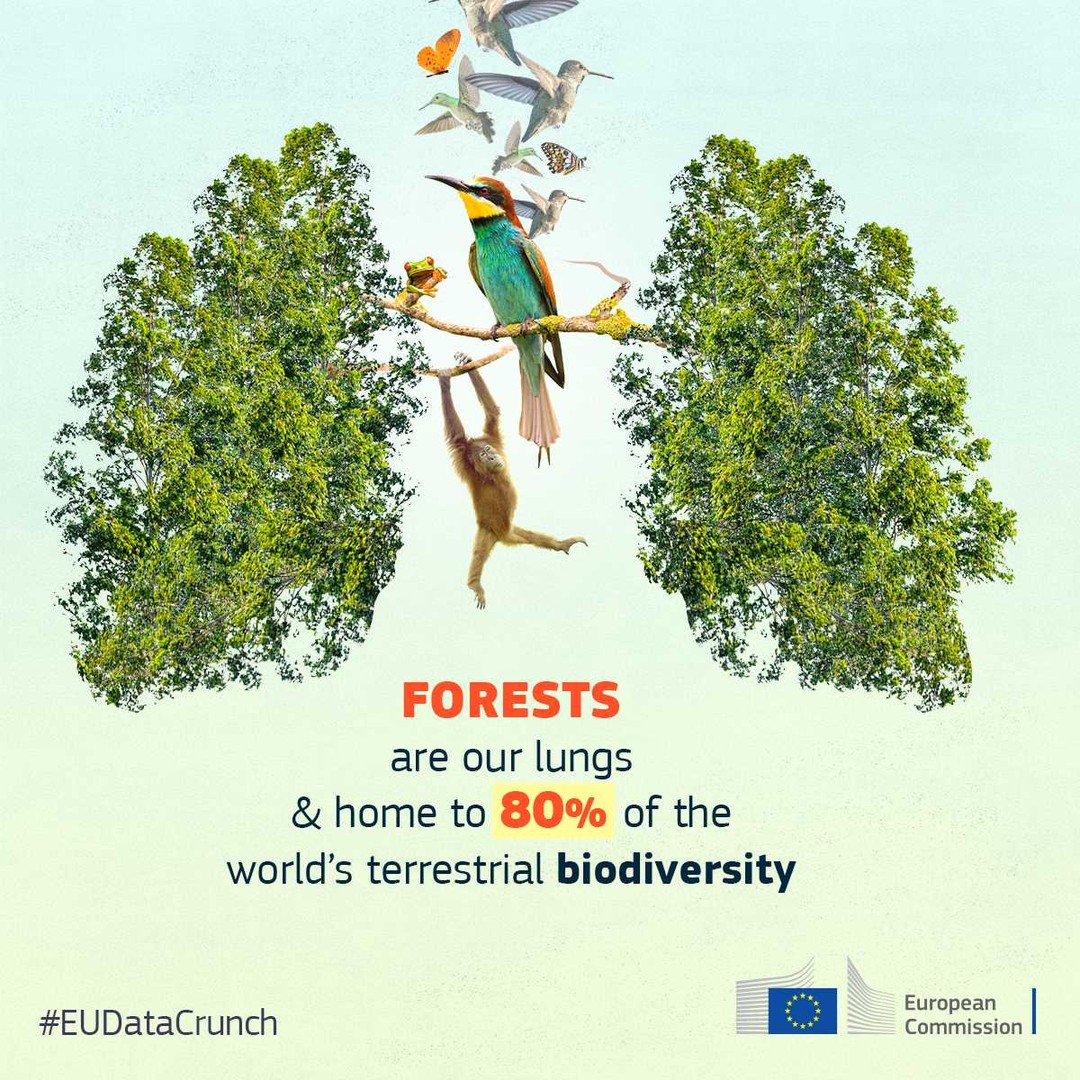
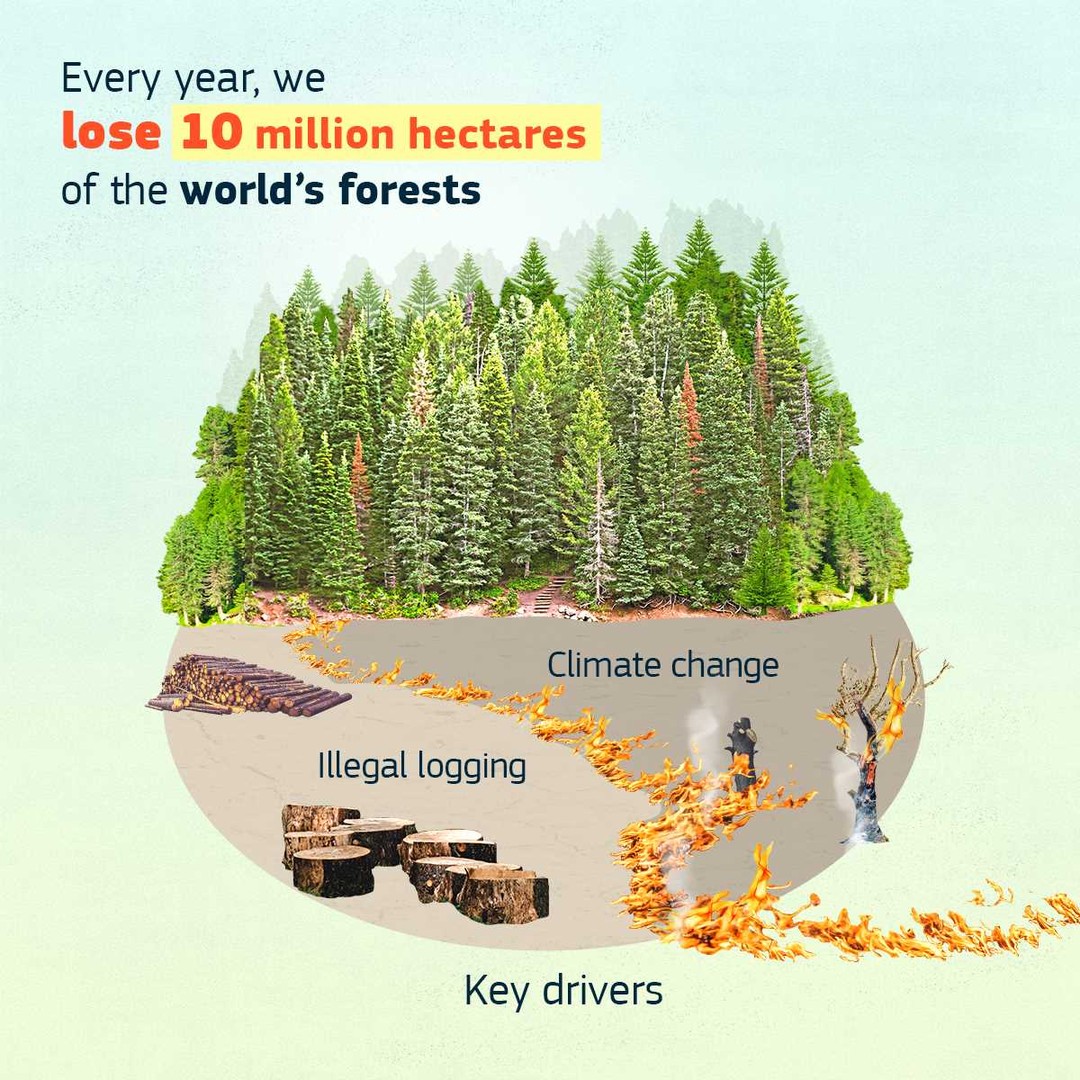
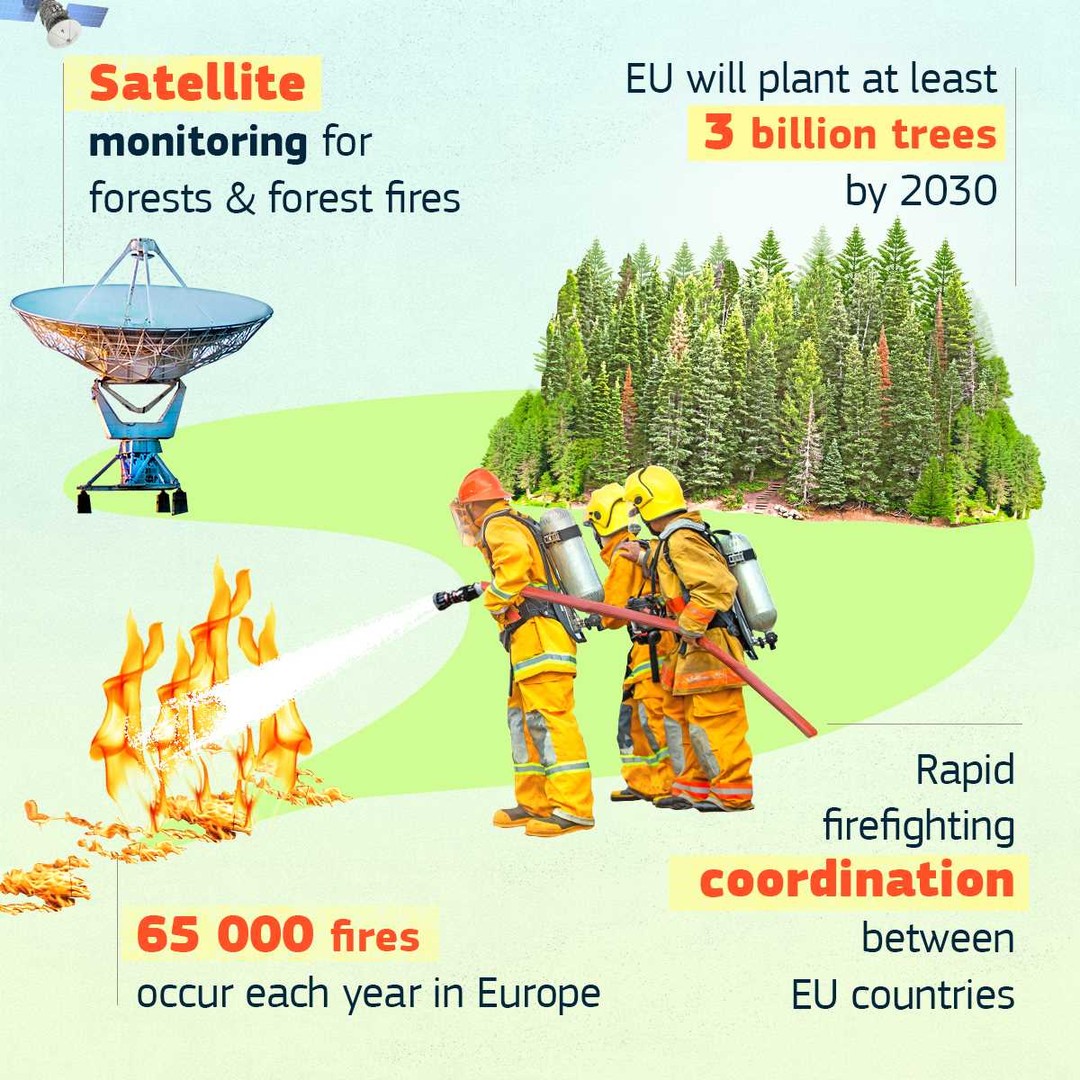
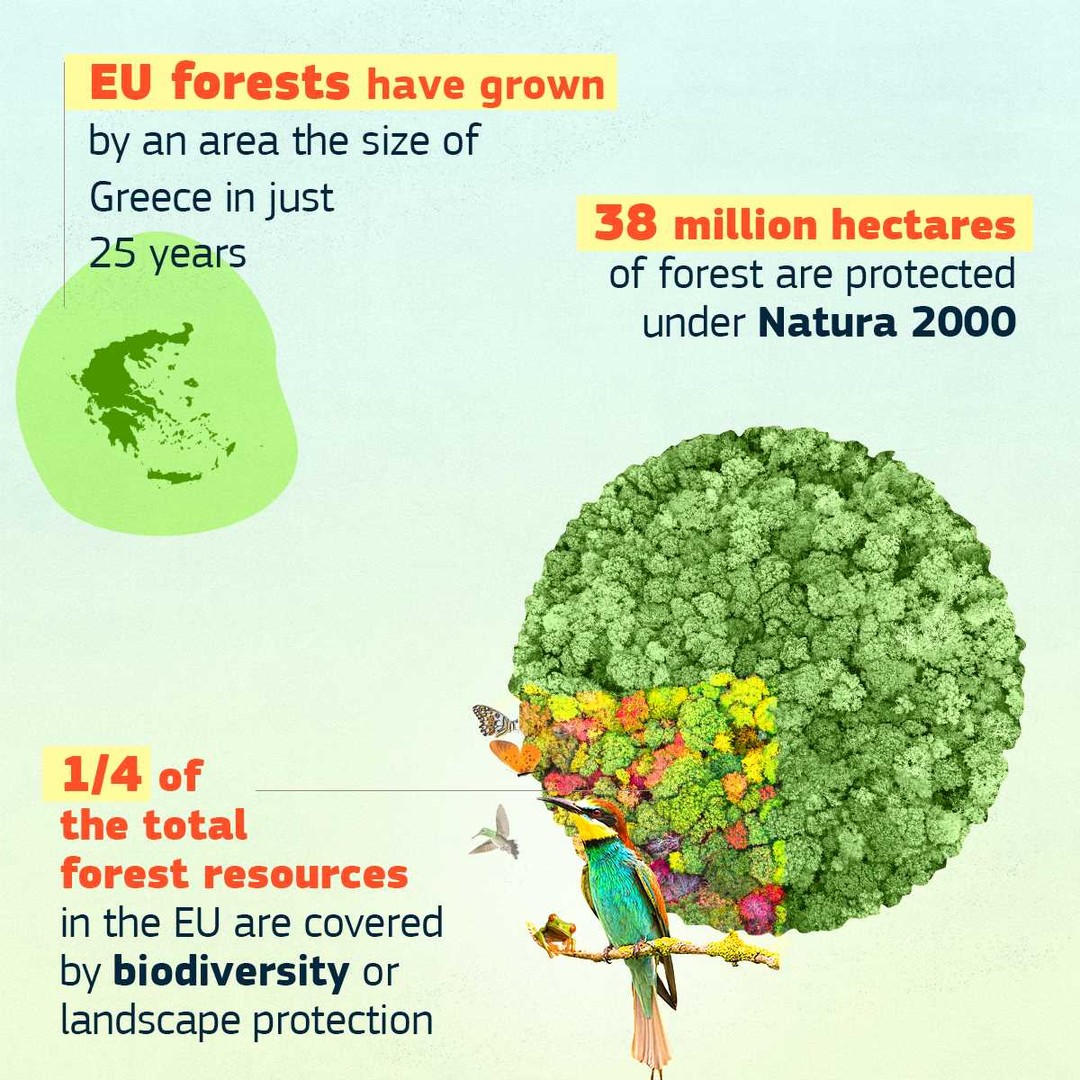
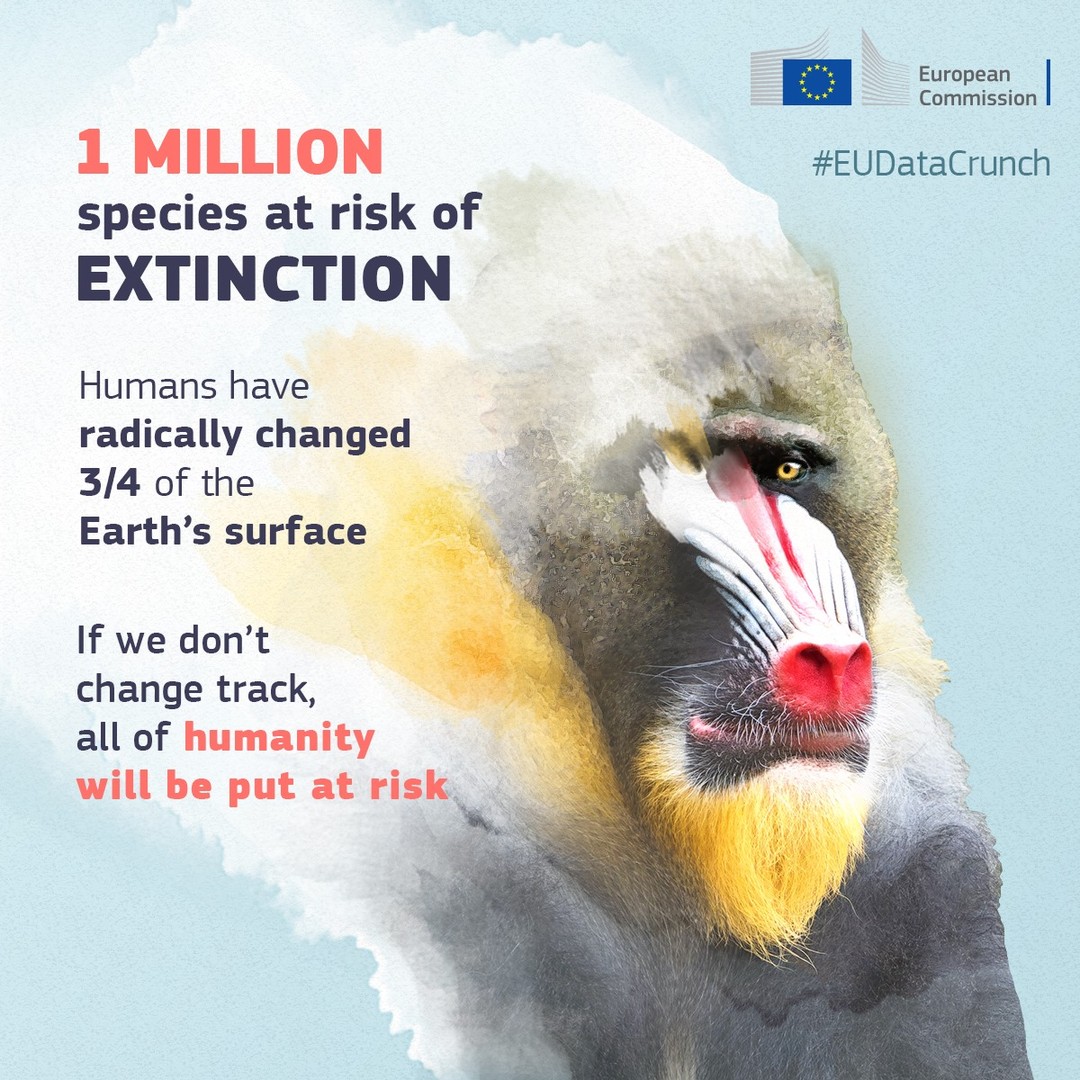
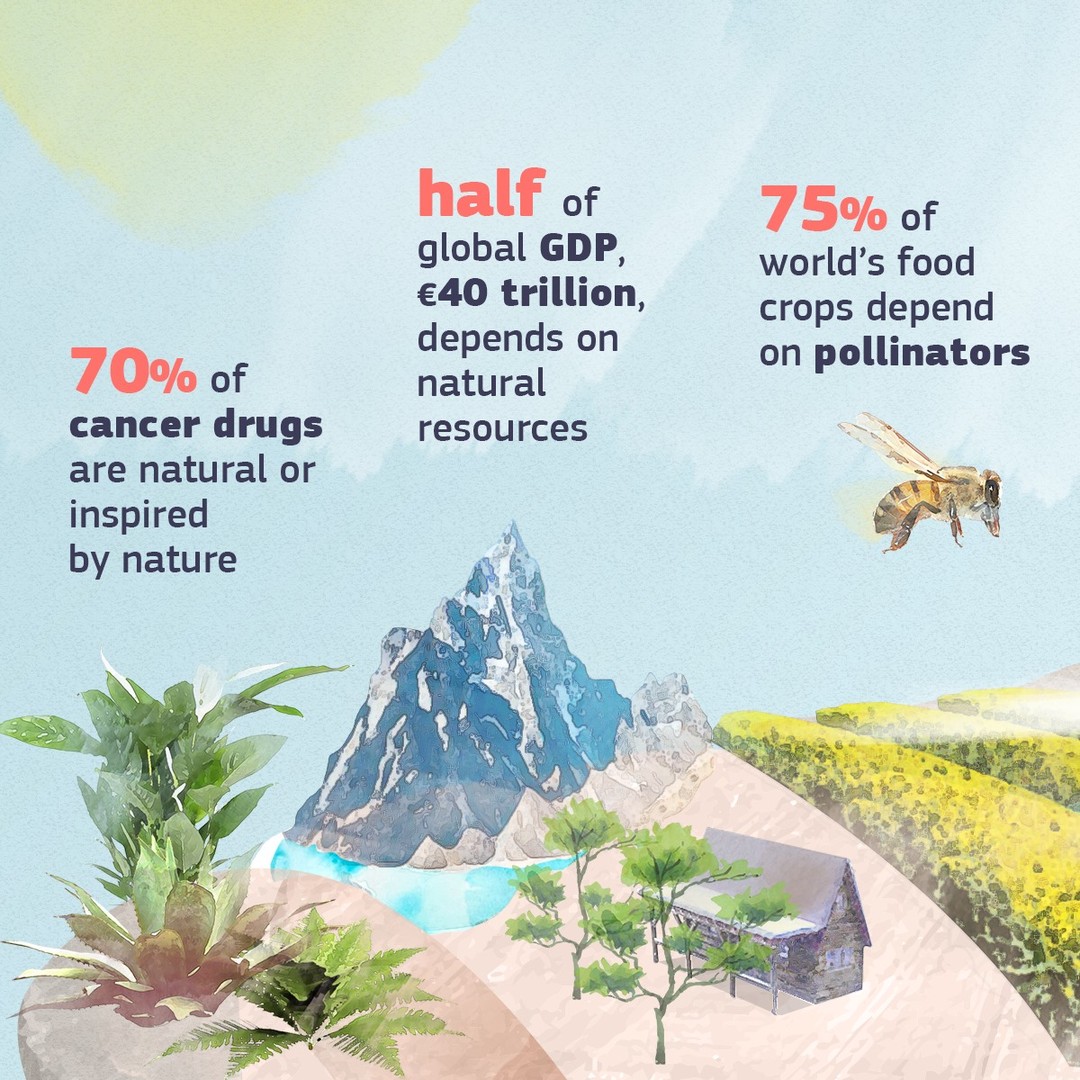
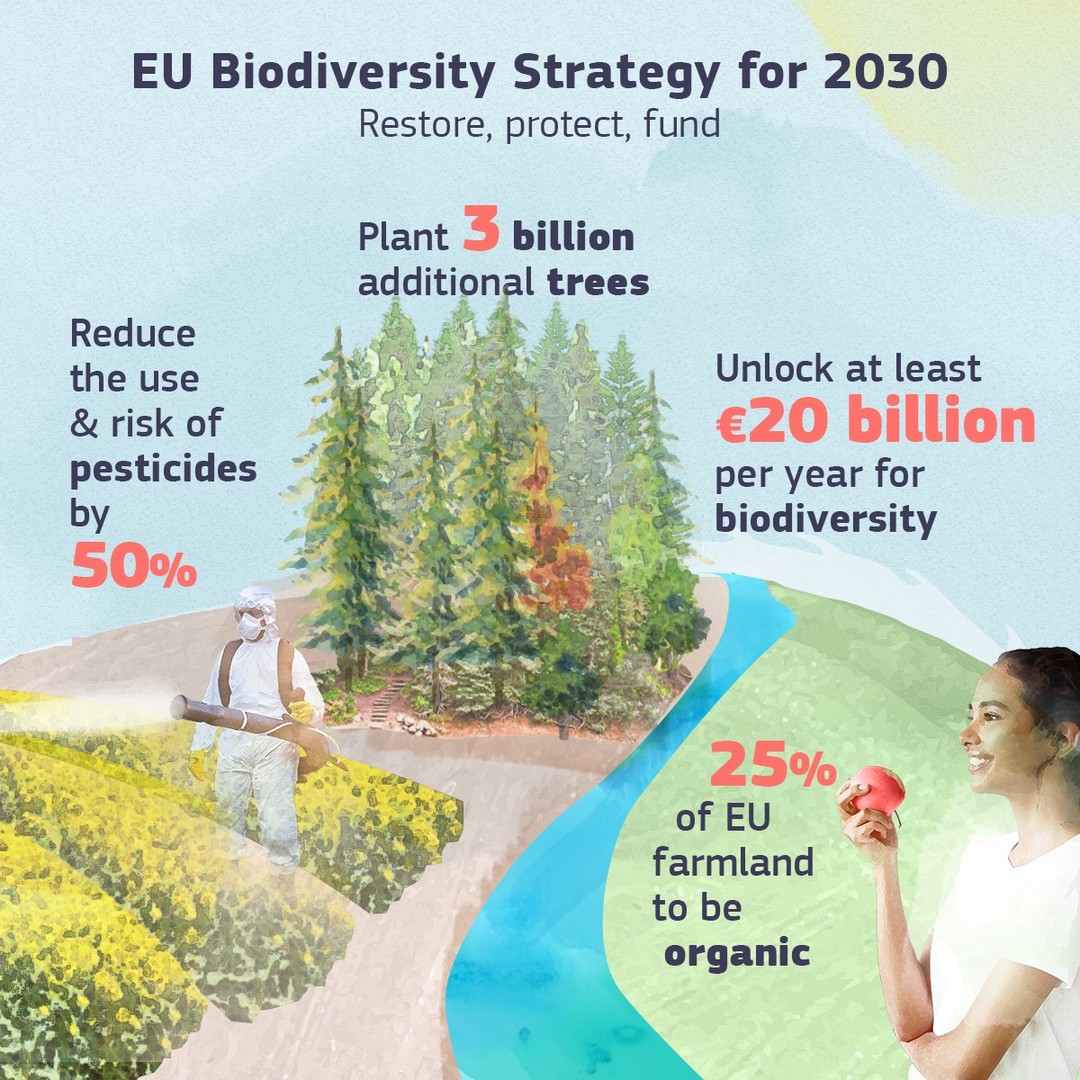
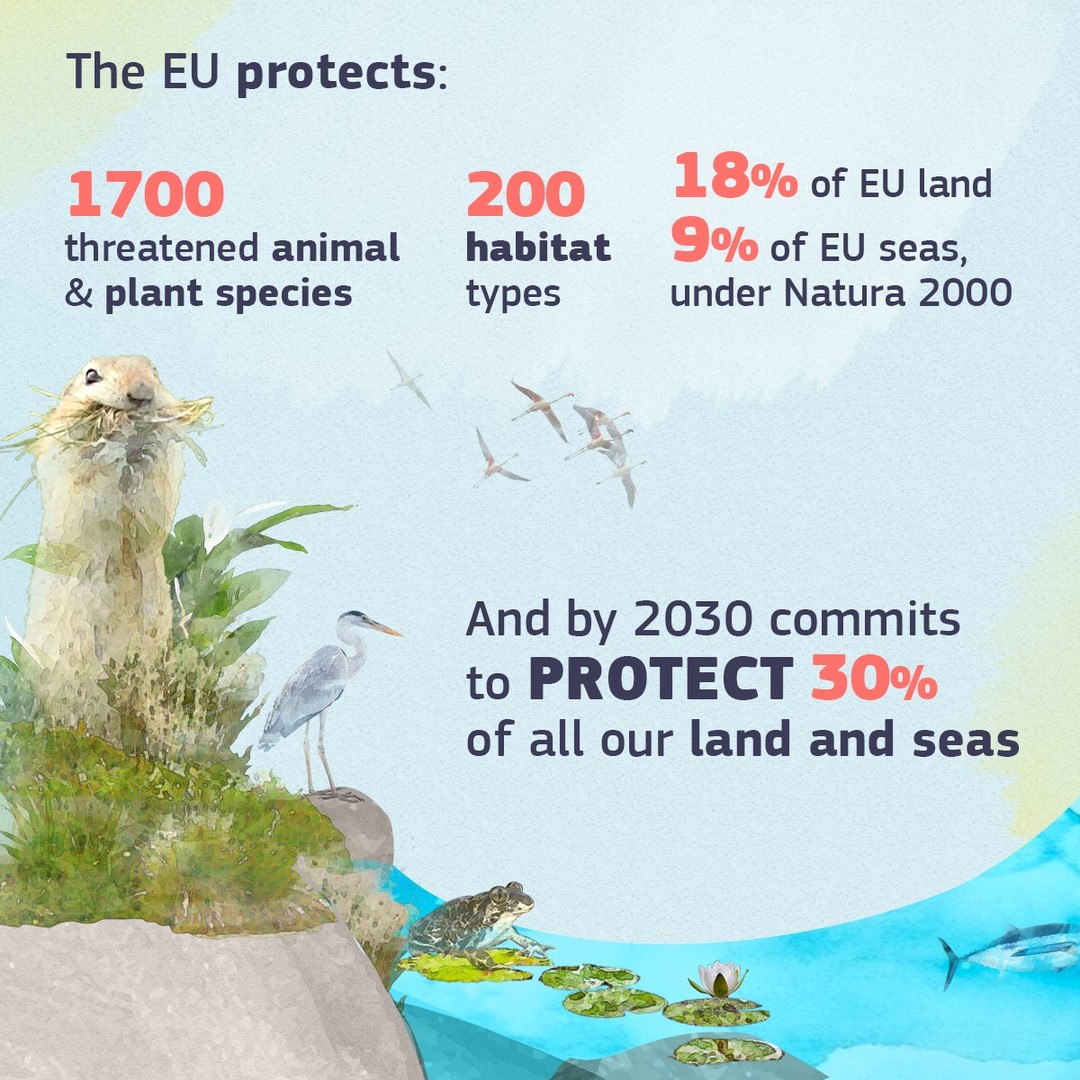
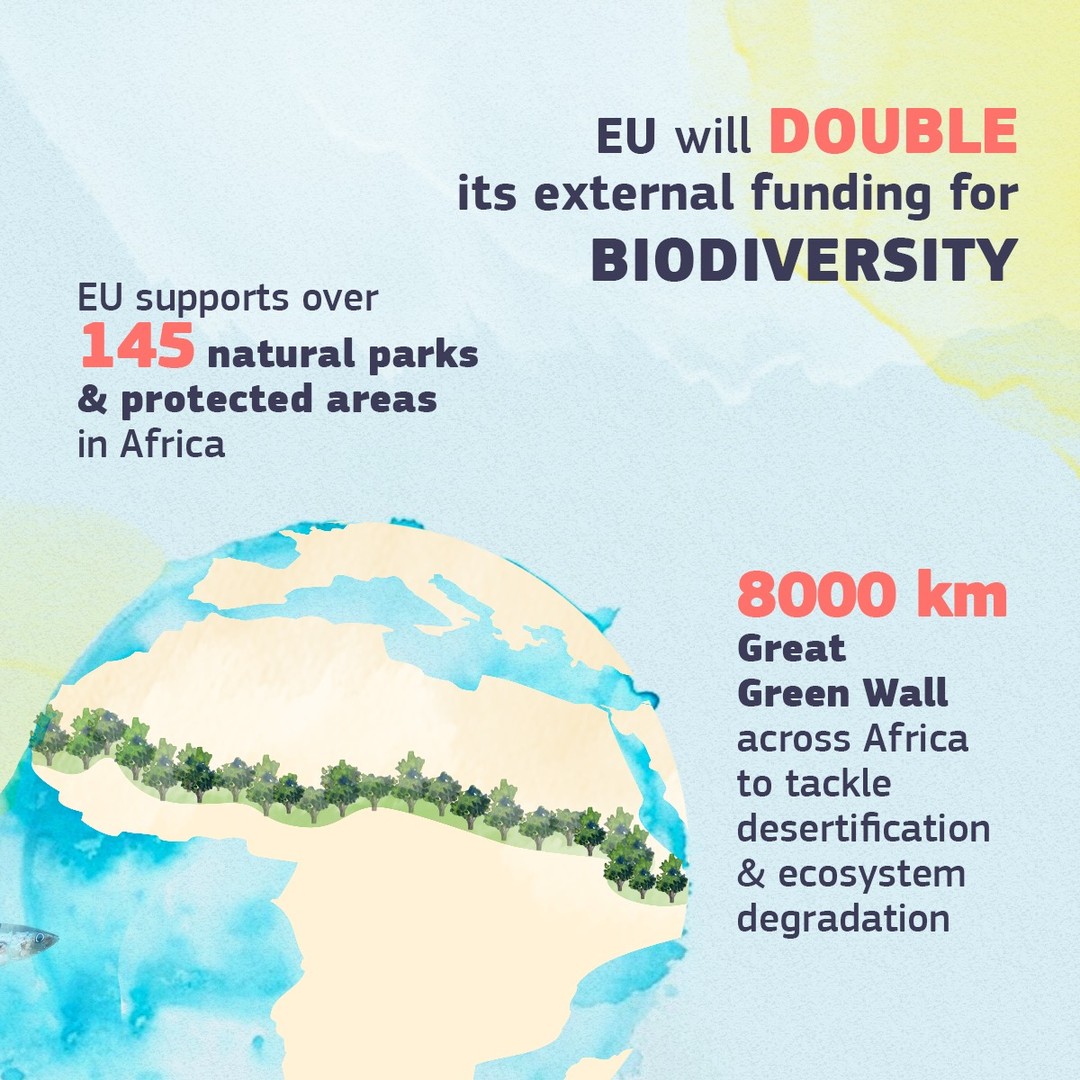
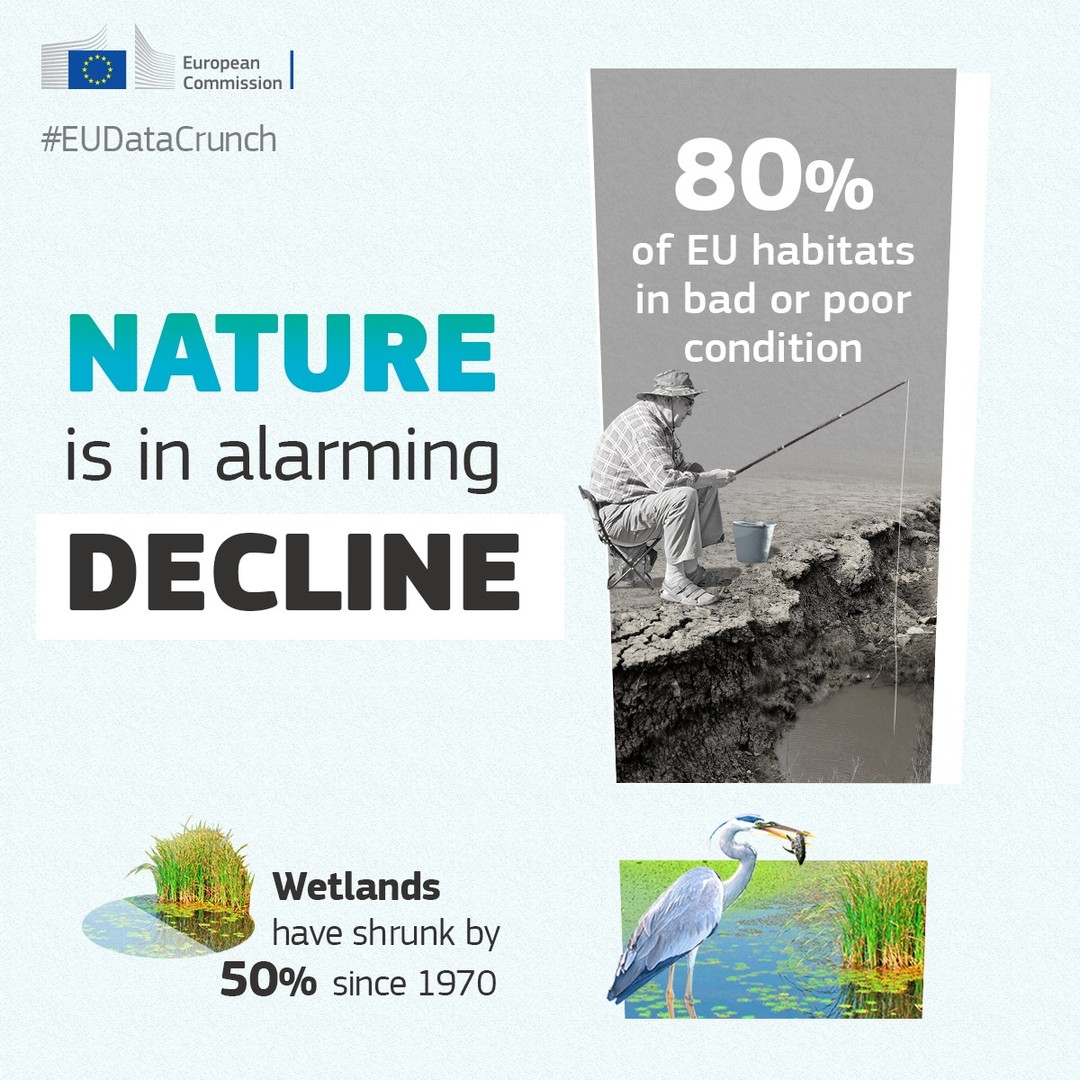
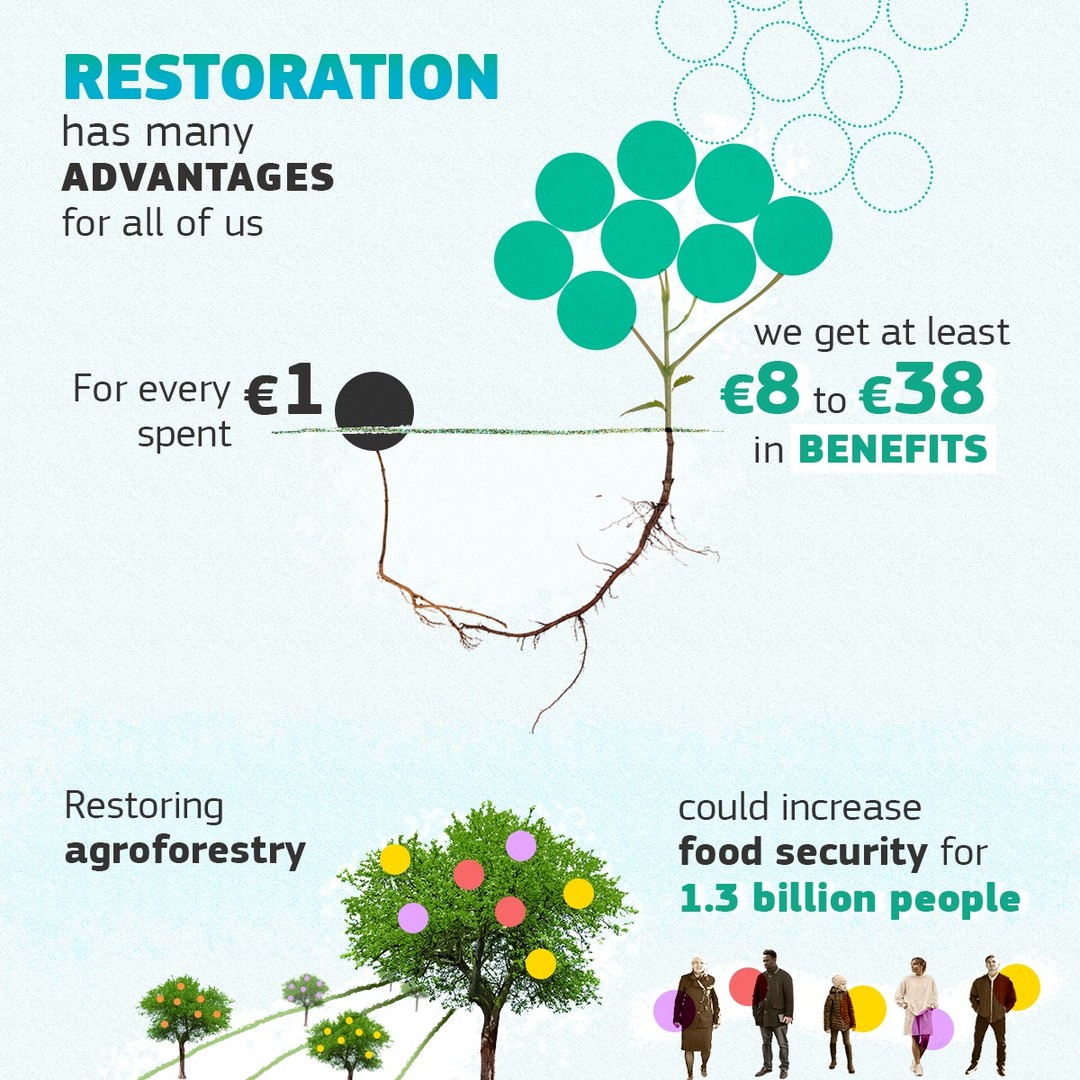
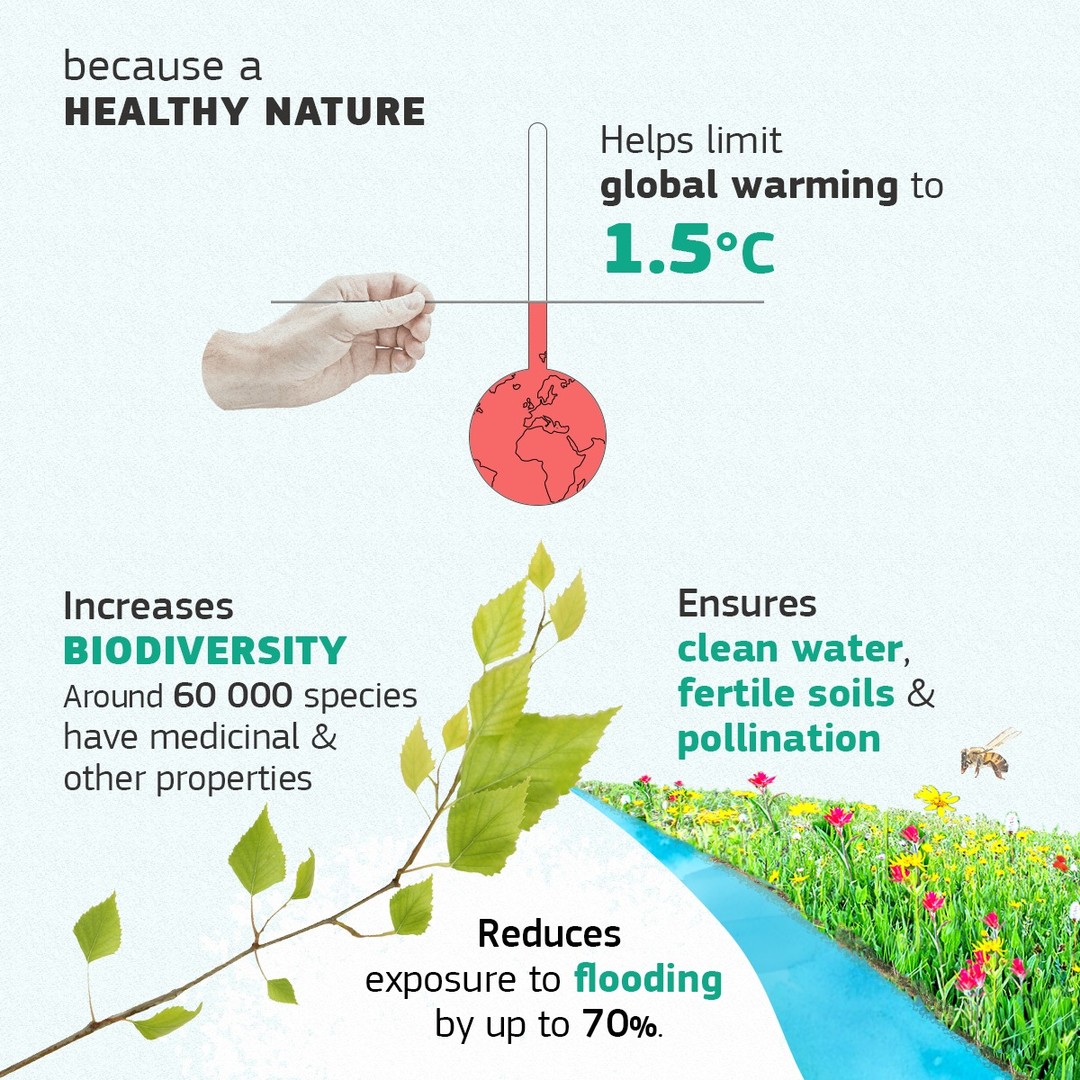
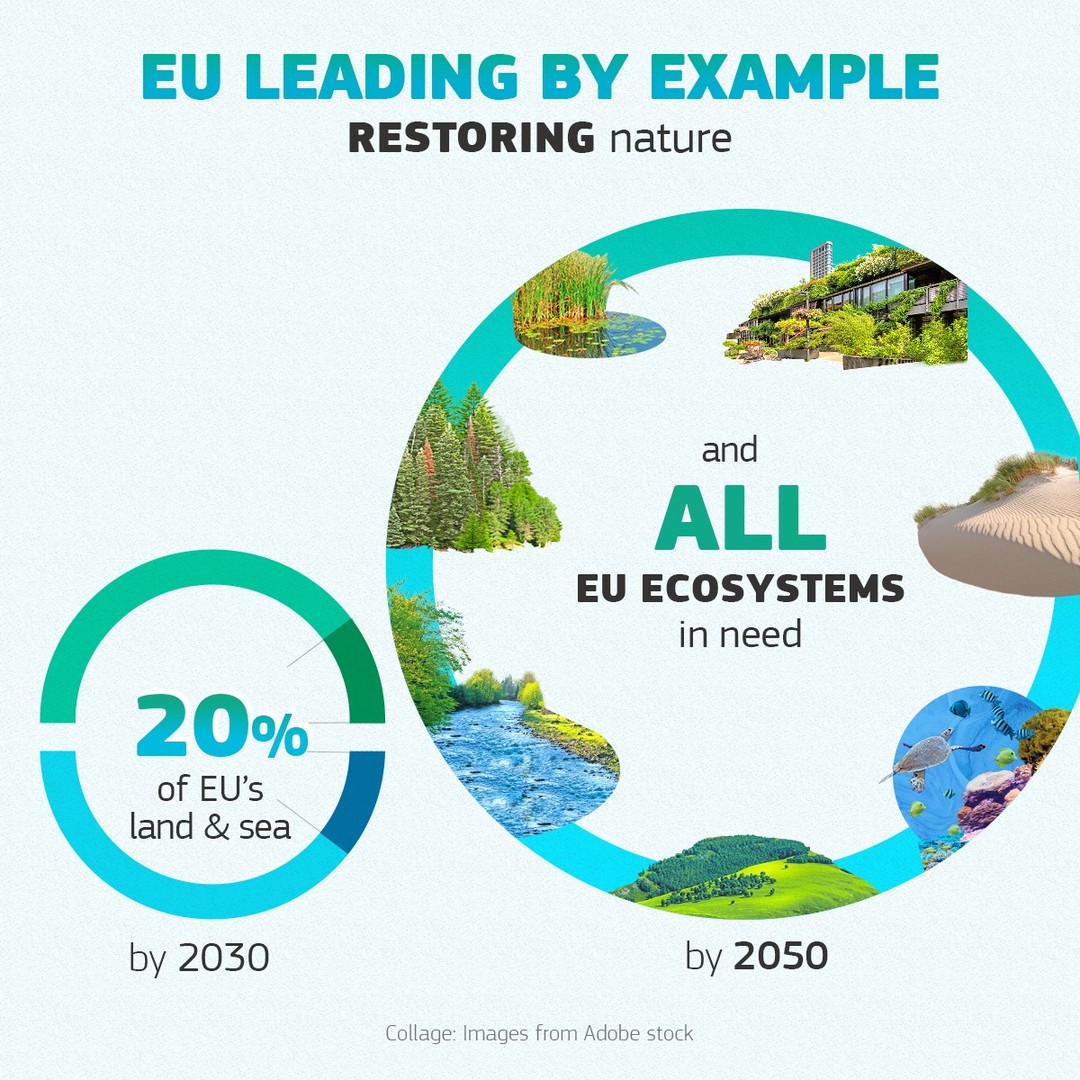
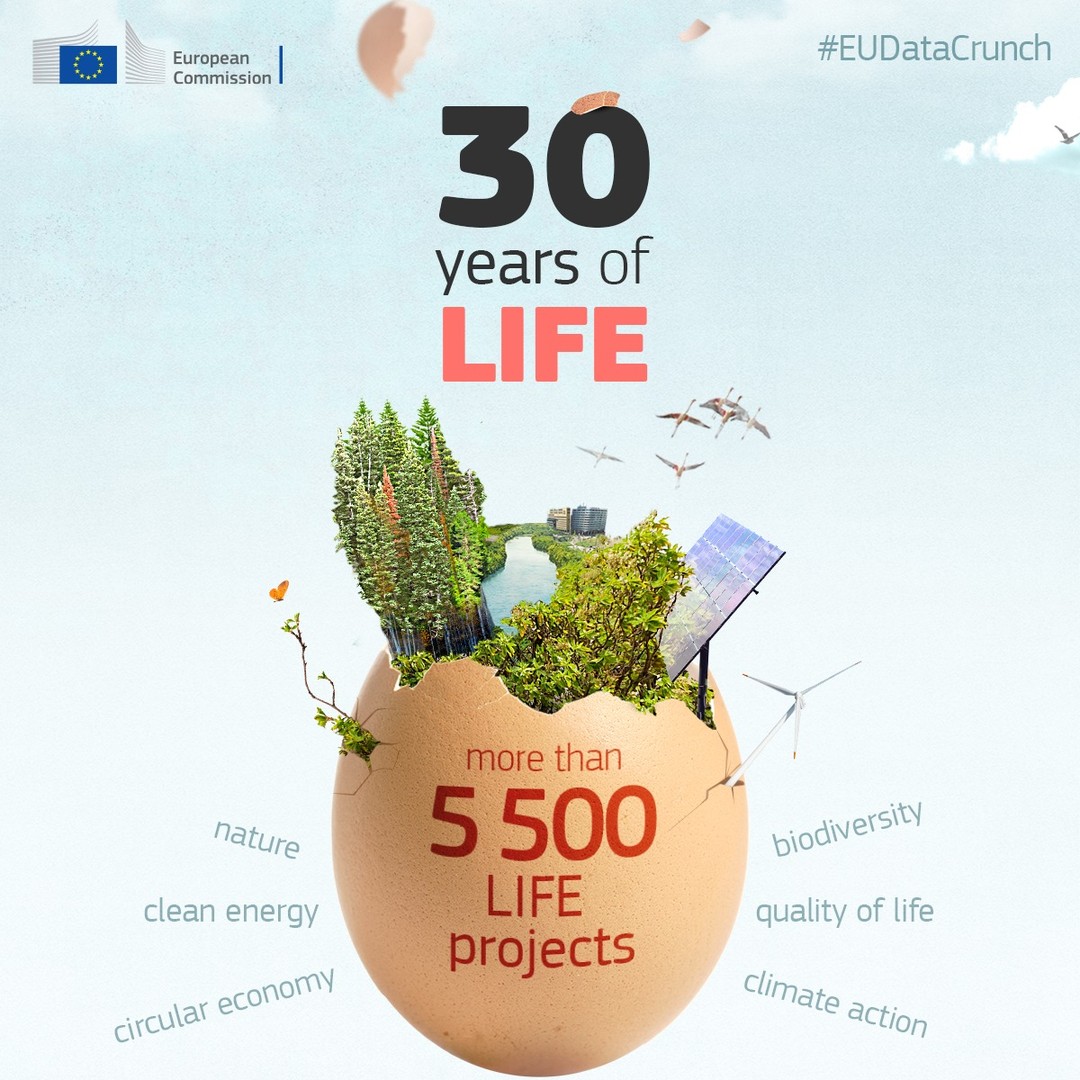
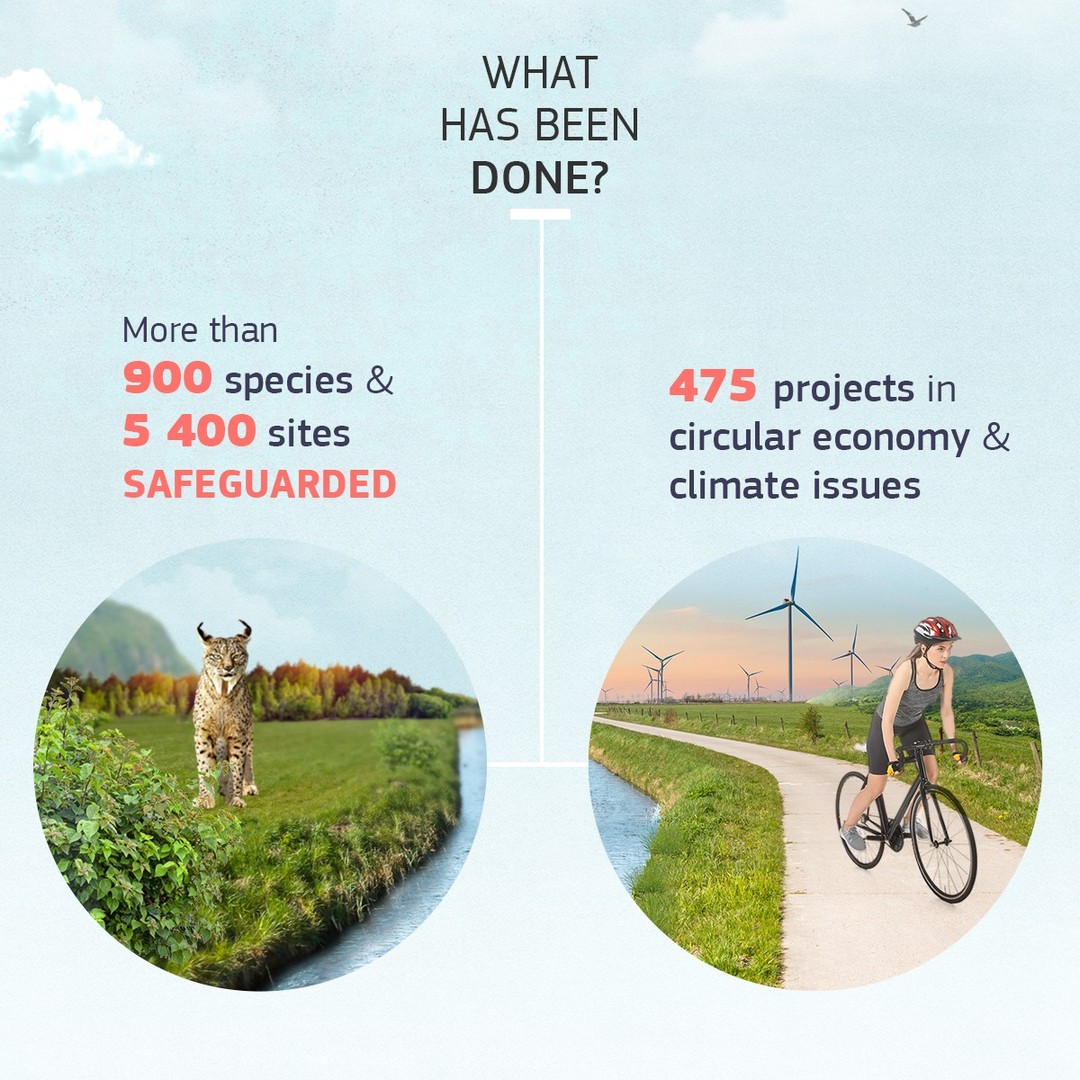
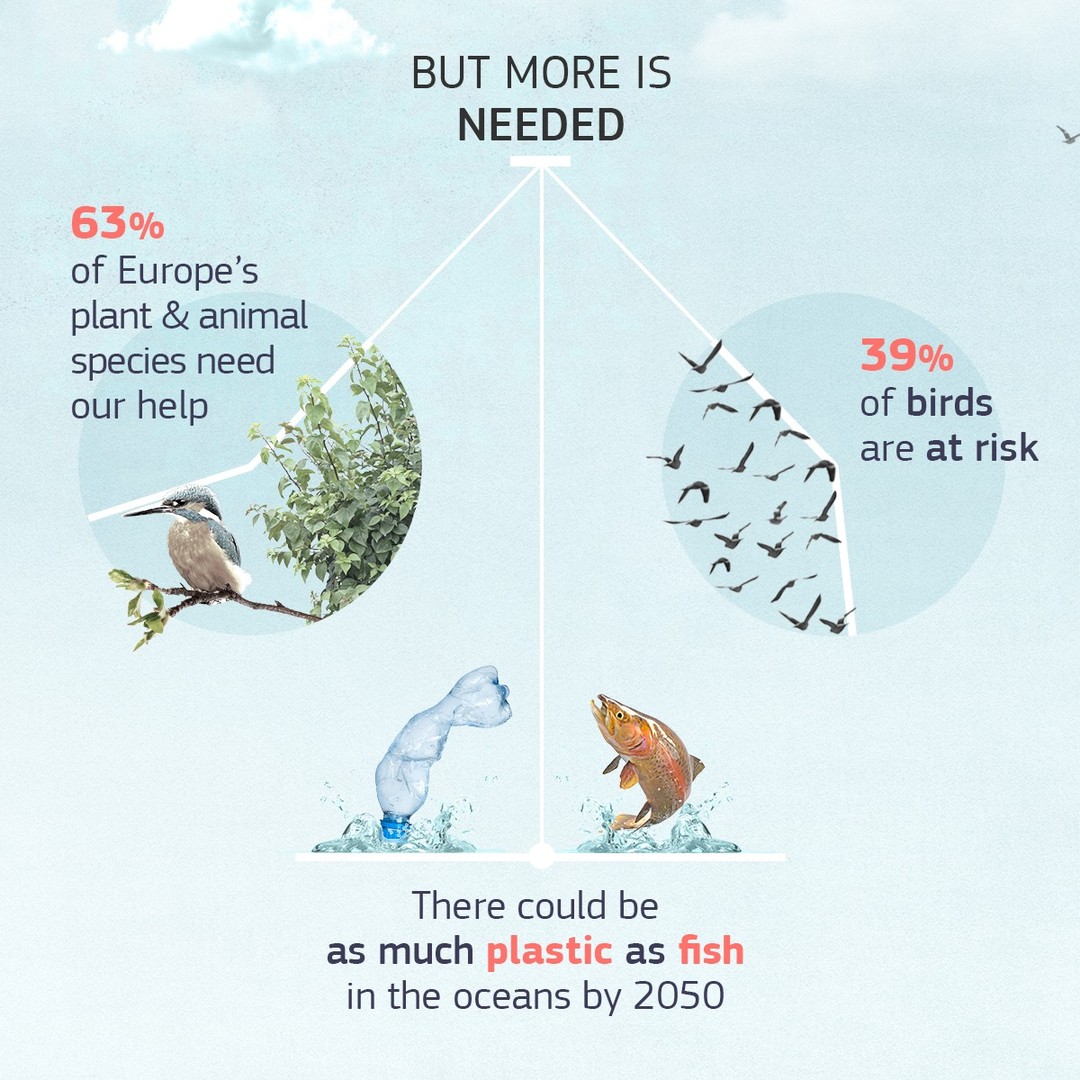
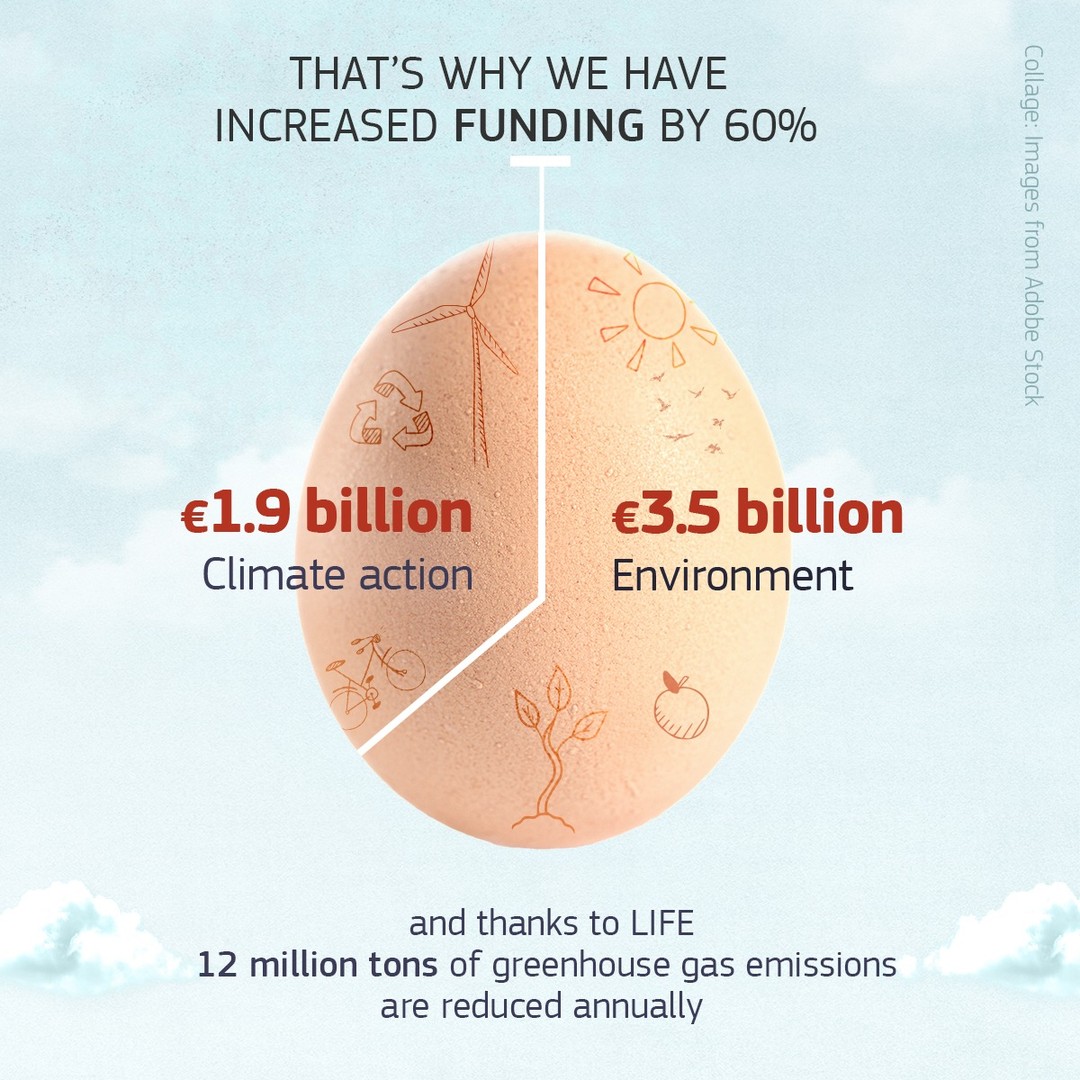
A narrative-led data story translating key biodiversity figures into a more illustrative sequence, with data selected and structured to support the story rather than a conventional data visualisation.
View original postConcept · Design
2021
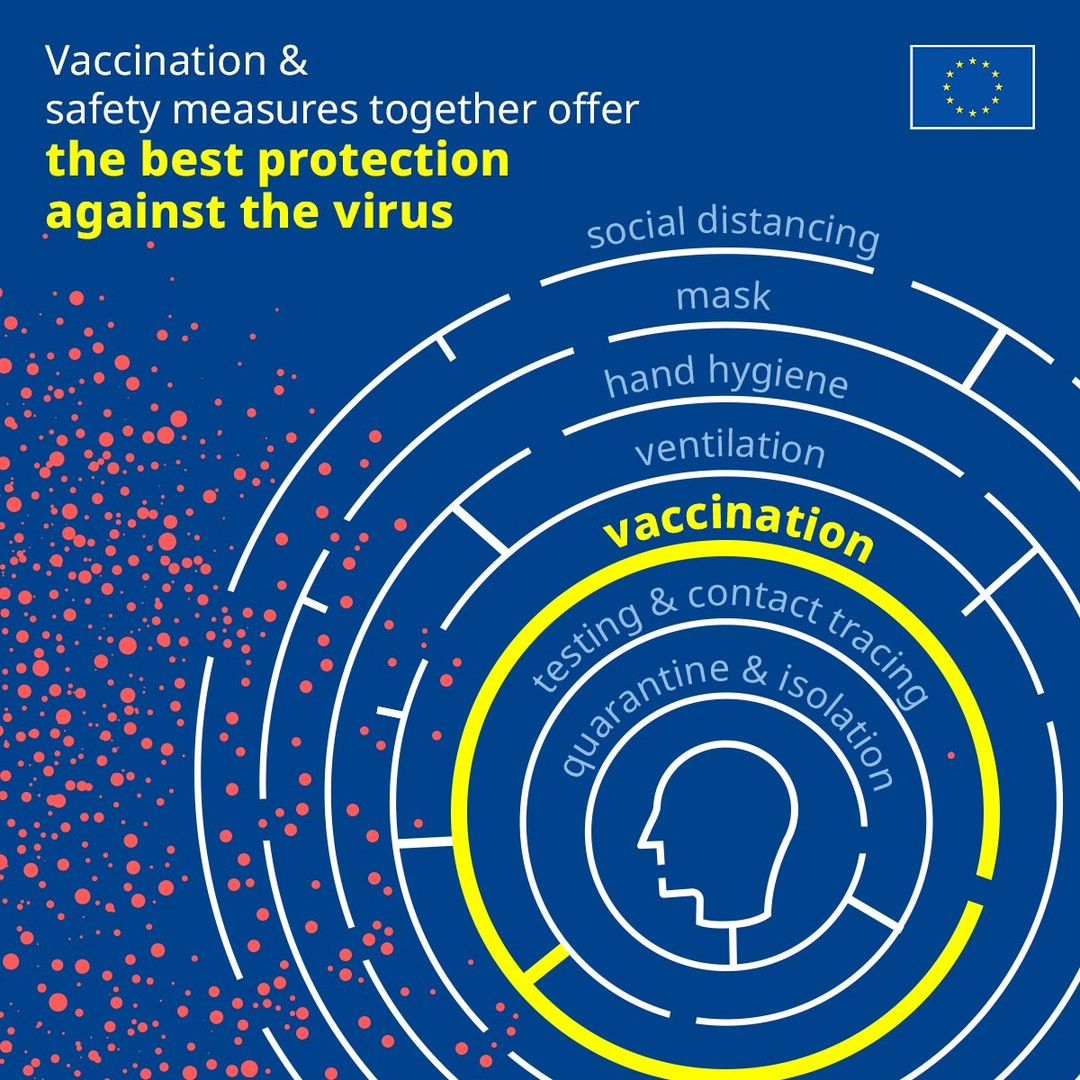
Created during the COVID-19 pandemic, this visual explains how different protective measures work together. Rather than relying on a single action, each layer adds another level of protection — reinforcing the importance of combining everyday precautions to reduce risk.
View original postEUDataCrunch project
Concept · Copy · Data Storytelling · Design
2022
View original postEUDataCrunch project
Data Storytelling · Design
2022
View original postEUDataCrunch project
Concept · Copy · Data Storytelling · Design
2022
View original postEUDataCrunch project
Concept · Copy · Data Storytelling · Design
2022
View original postEUDataCrunch project
Concept · Copy · Data Storytelling · Design
2022
View original postDesign
2022
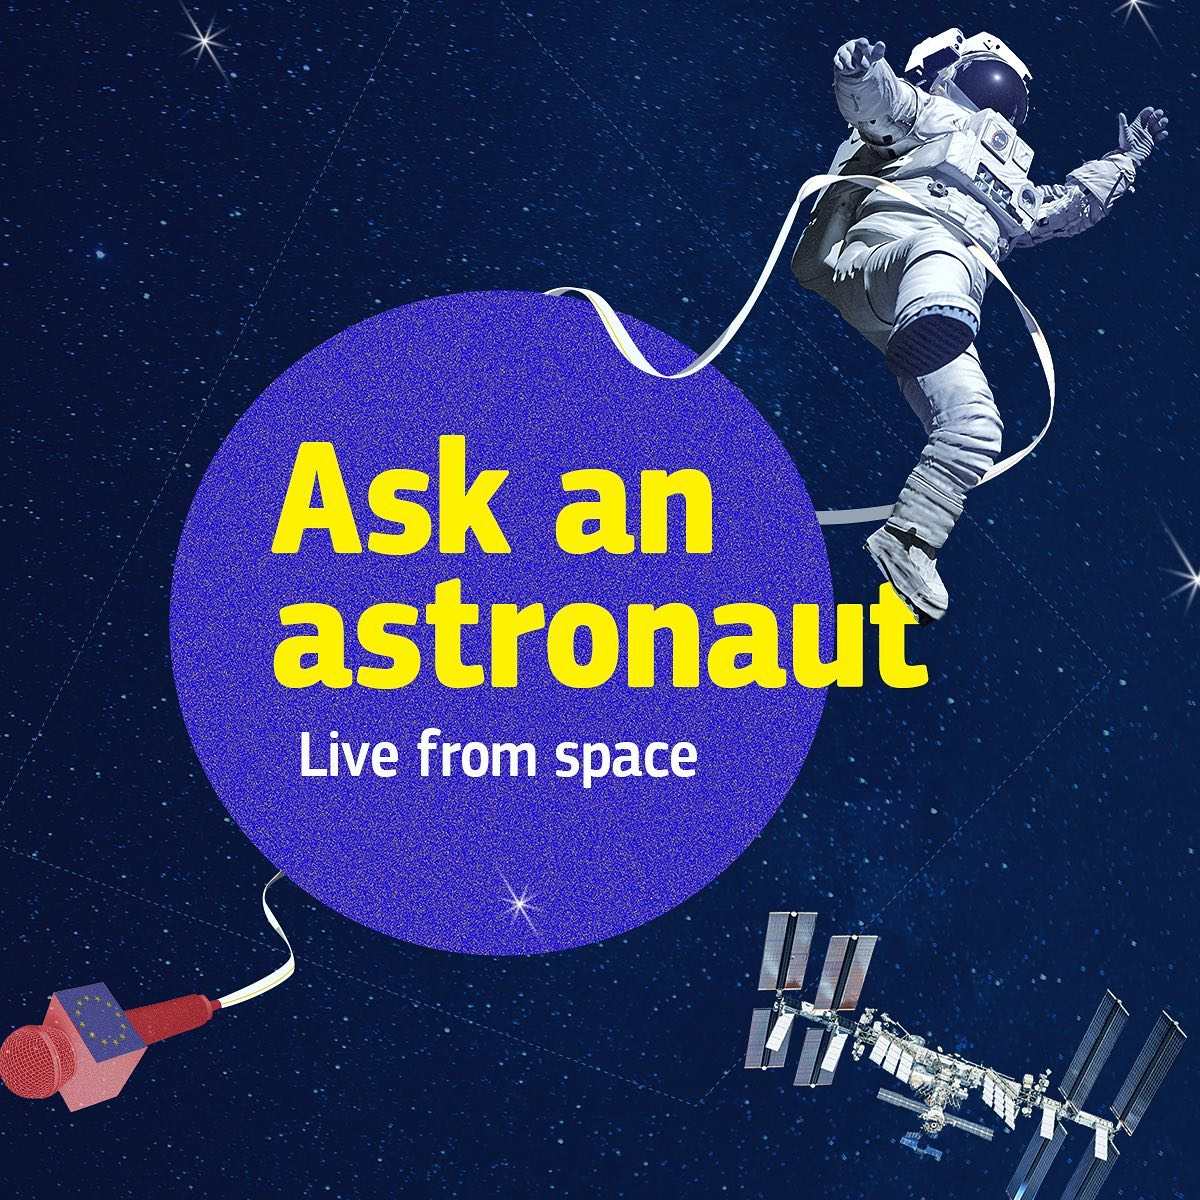
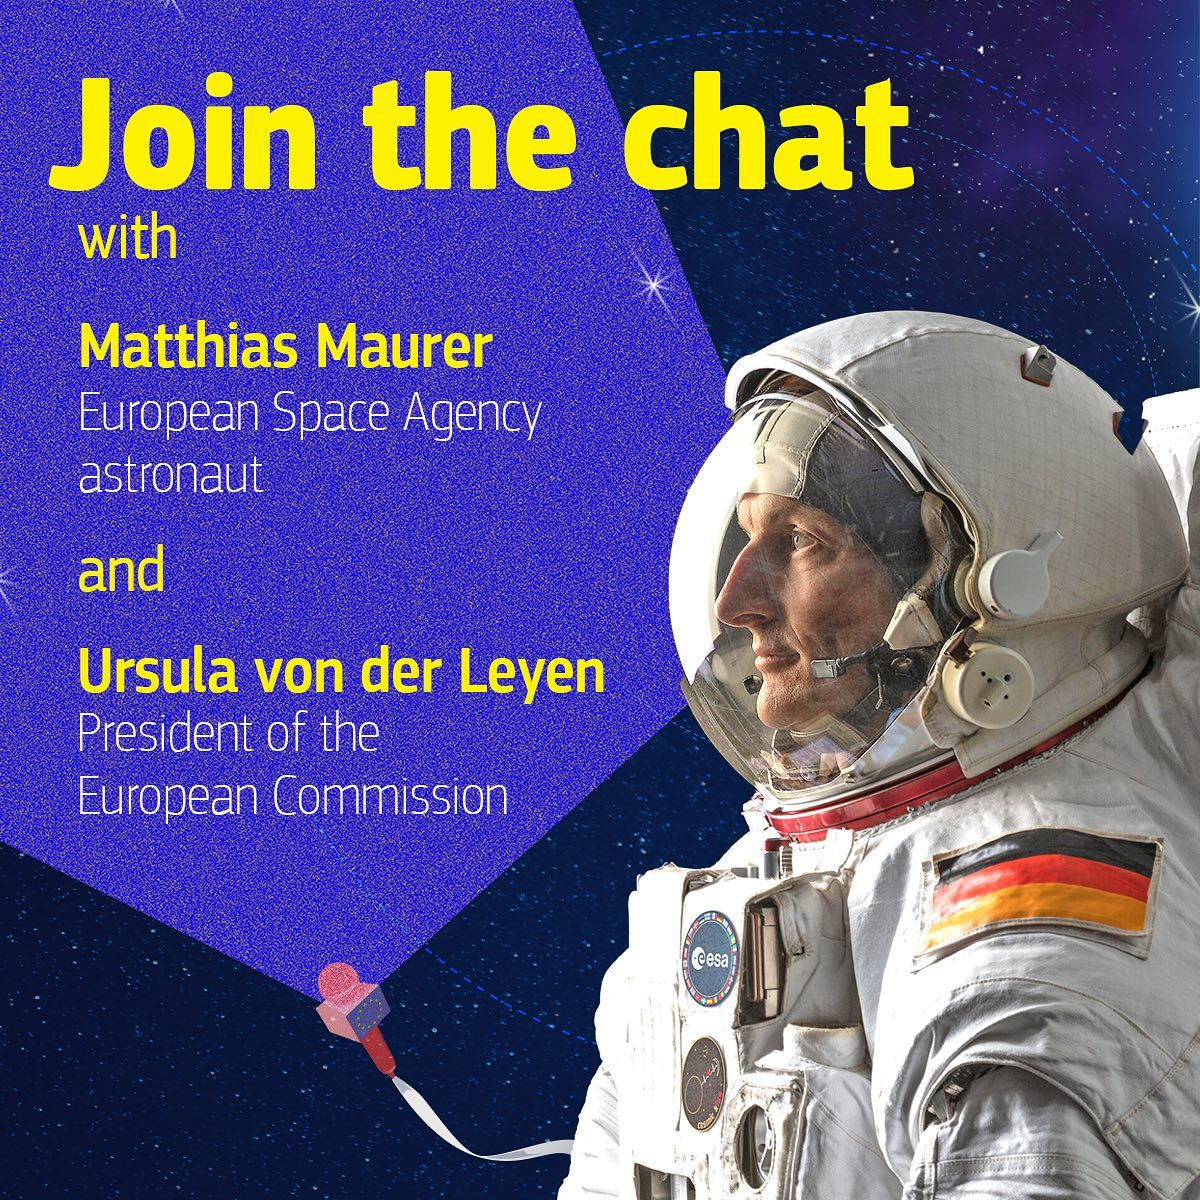
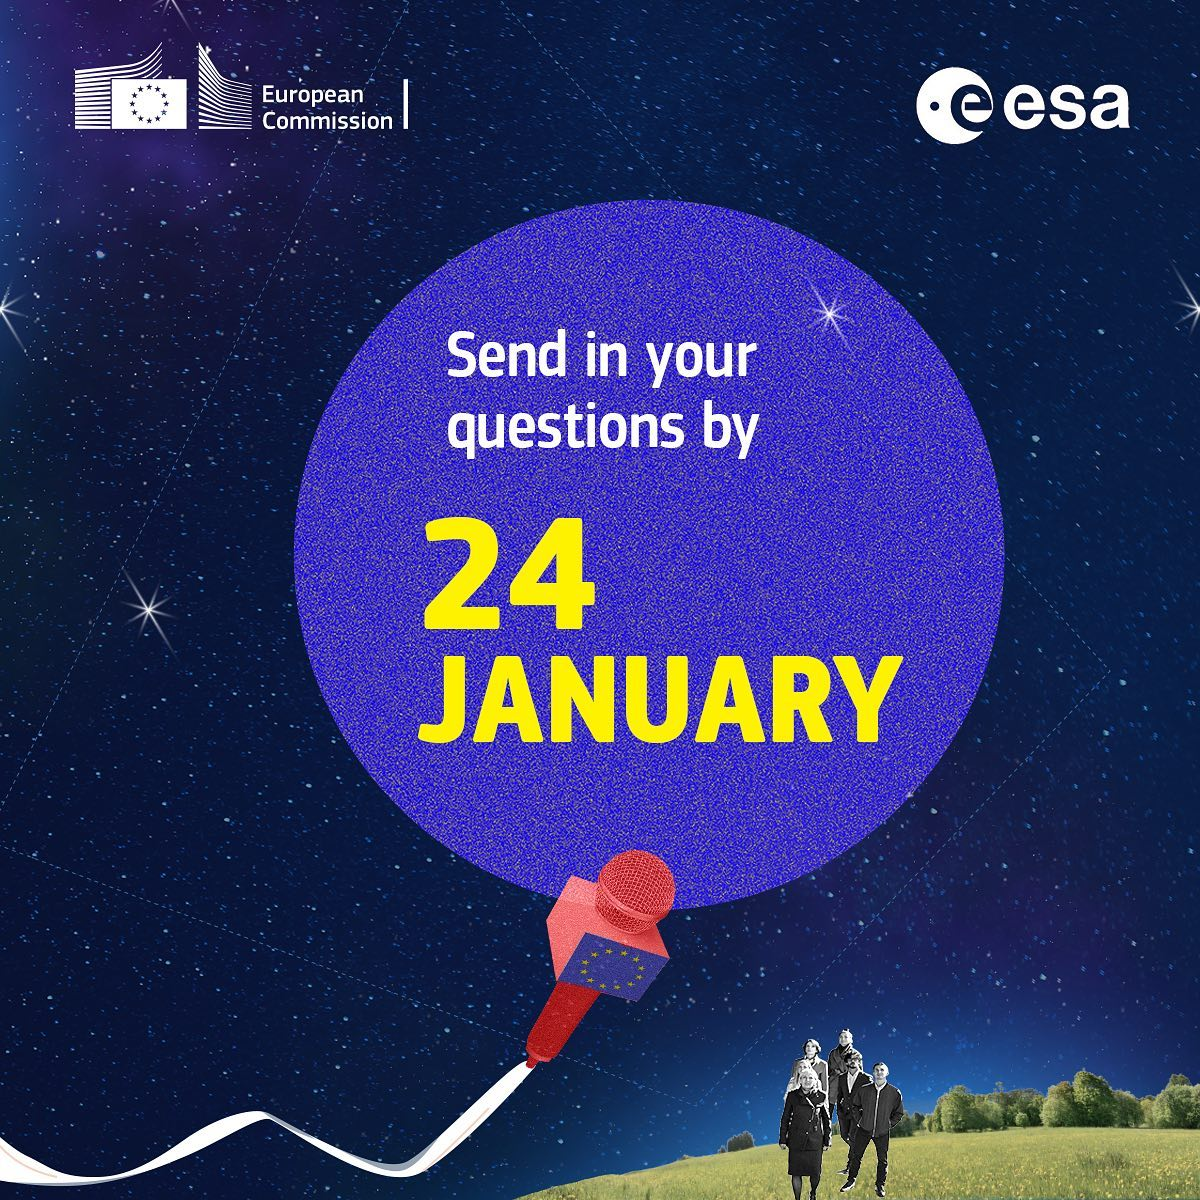
Social visuals inviting questions for the European Commission’s SpaceChat with Ursula von der Leyen and ESA astronaut Matthias Maurer, live from the International Space Station.
View original postConcept · Copy · Design
2026
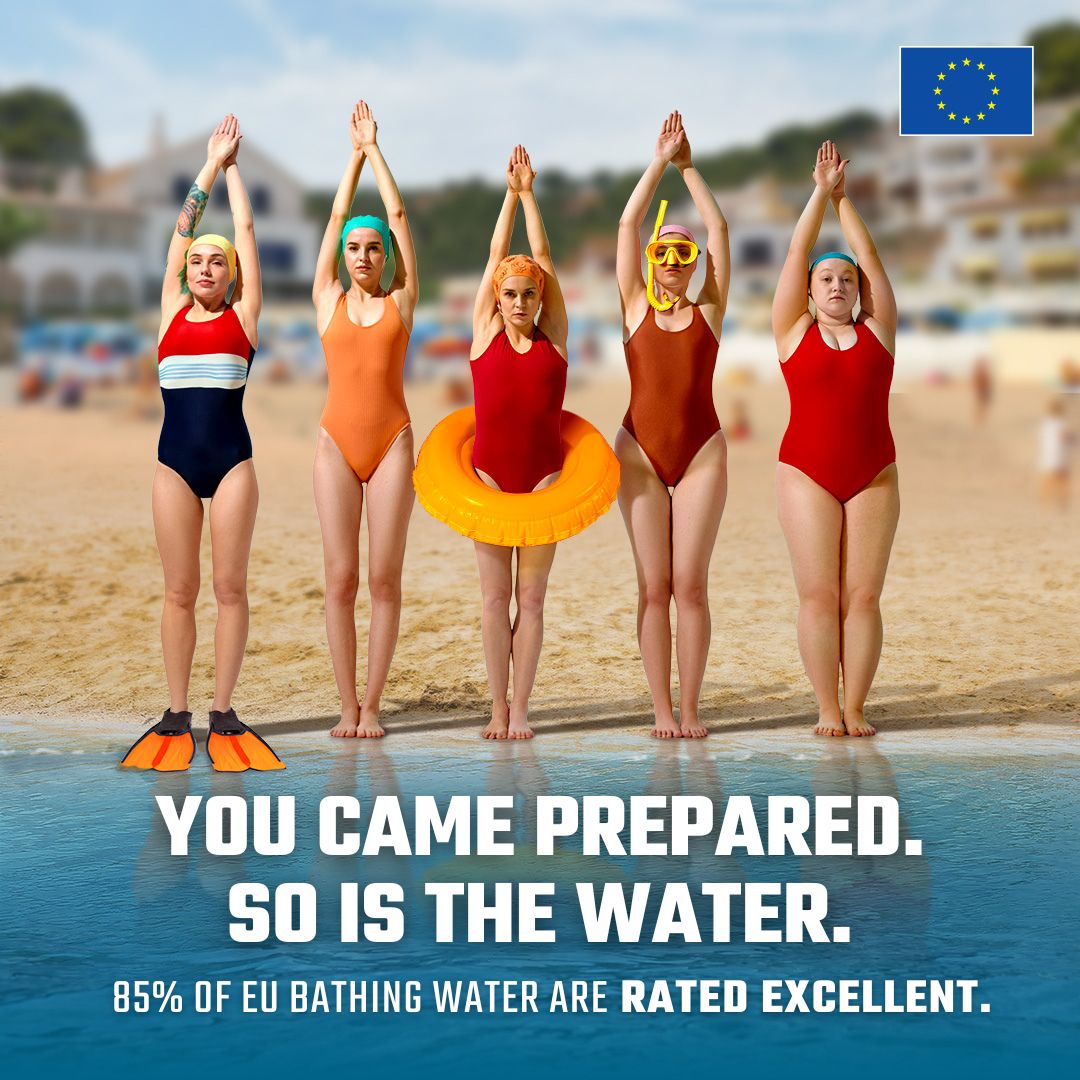
The women seem to have trained all year just to take a swim. The joke mirrors the unseen work behind good bathing-water quality: visitors simply arrive and enjoy the result.
View original postConcept · Copy · Design
2026
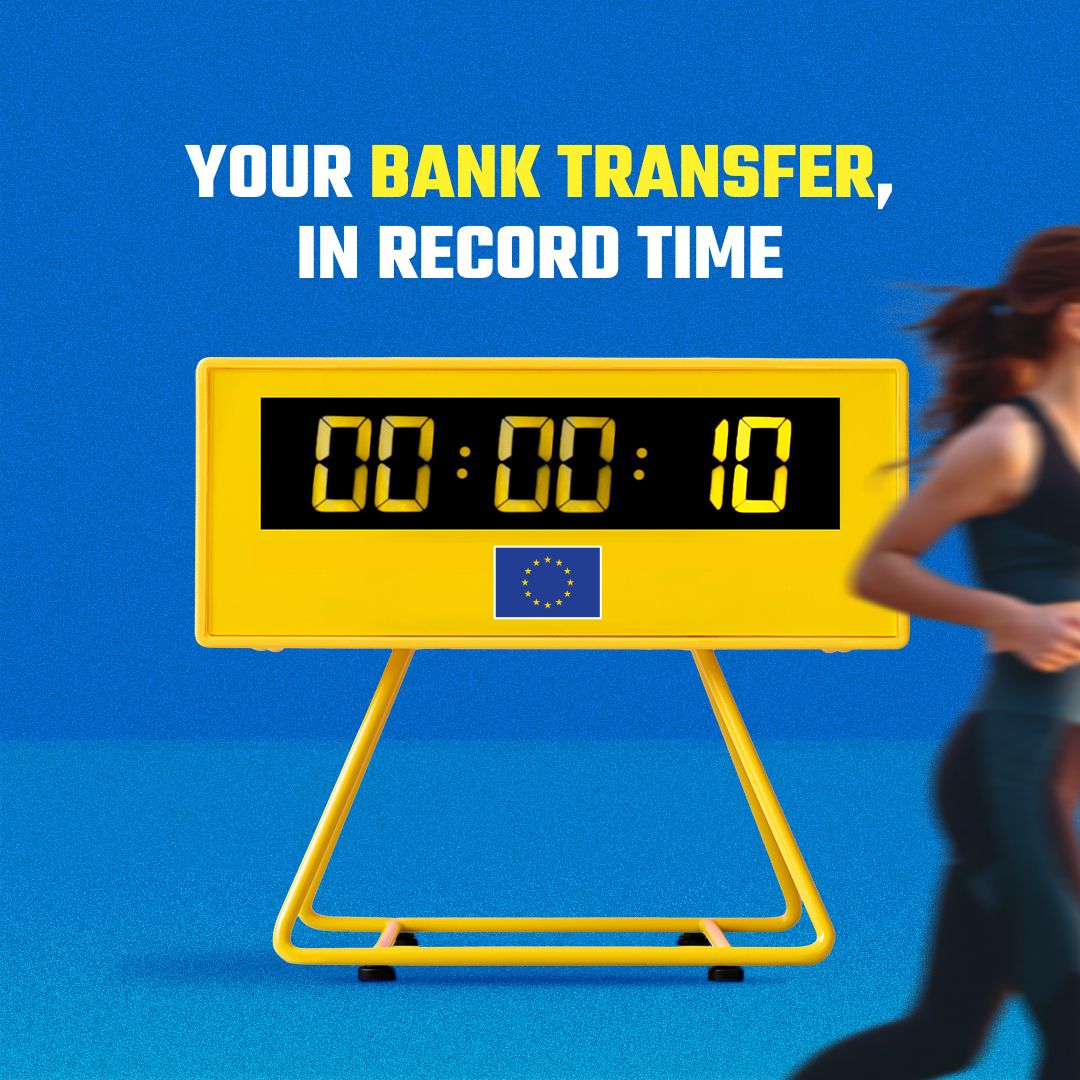
A race timer and a runner translate the speed of an instant bank transfer into a sporting metaphor: your money arrives in record time.
View original postConcept · Design
2026
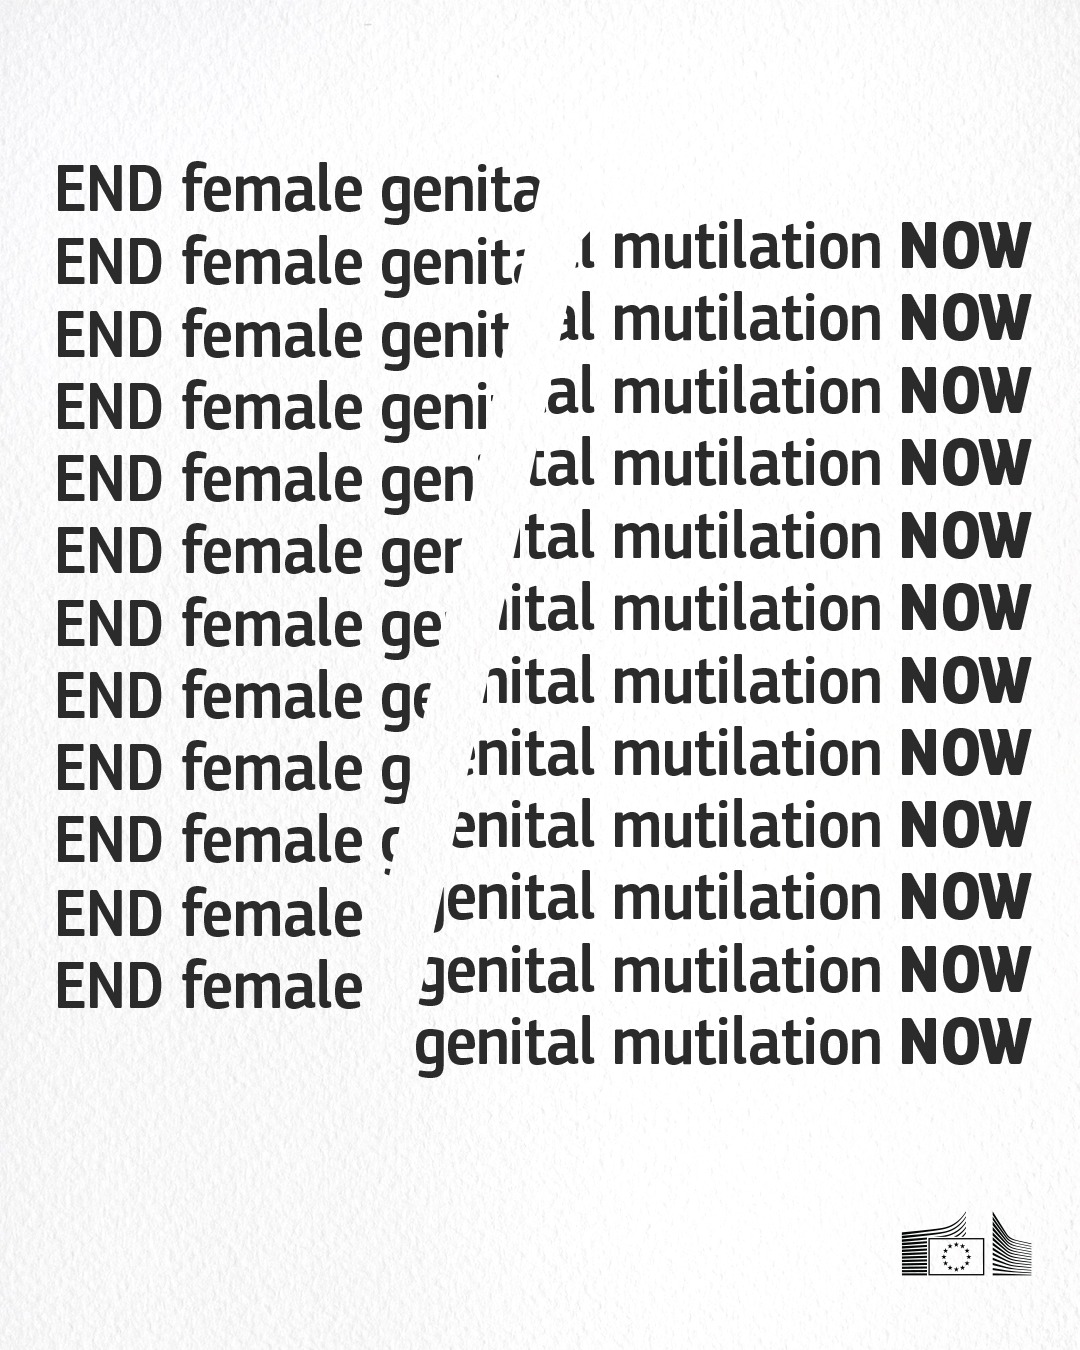
A fractured phrase turns mutilation into a typographic rupture.
View original postConcept · Copy · Photomontage
2026
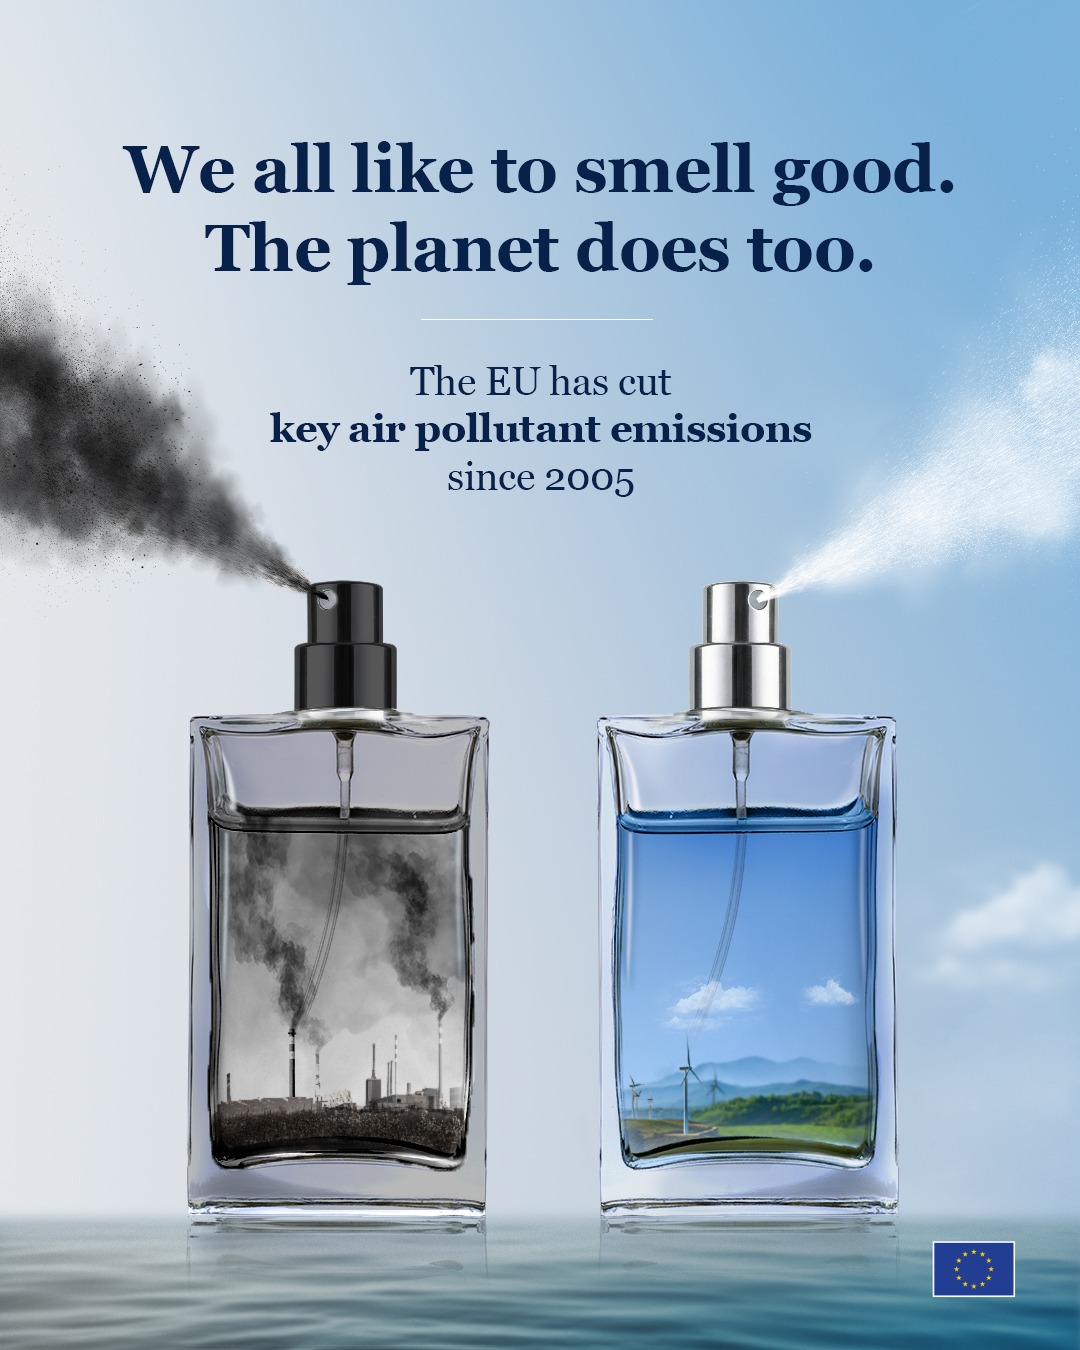
Two perfume bottles contrast industrial smoke with a cleaner landscape, turning a familiar desire to smell good into a visual idea about cleaner air.
View original postConcept · Illustration
2026
A book becomes a power symbol in a concise visual metaphor for education.
View original postDesign
2023
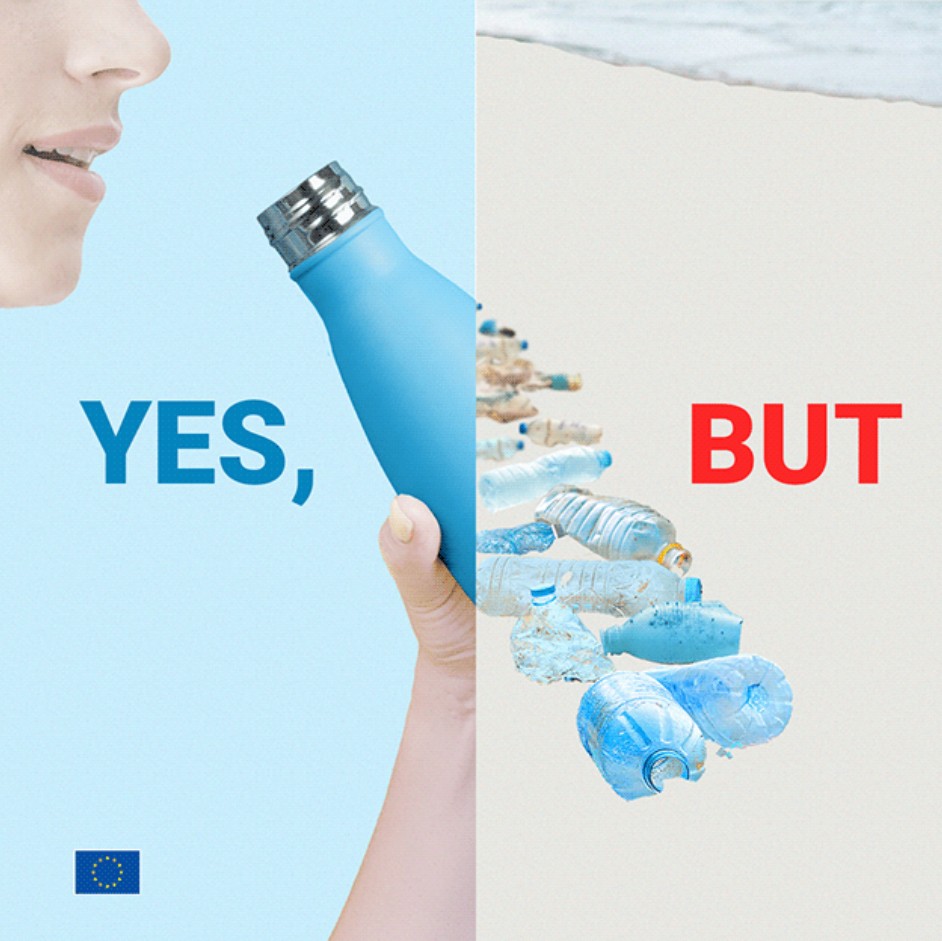
Questioning the limits of individual action by contrasting personal zero-waste choices with the much larger scale of plastic waste.
View original postConcept · Illustration
2025
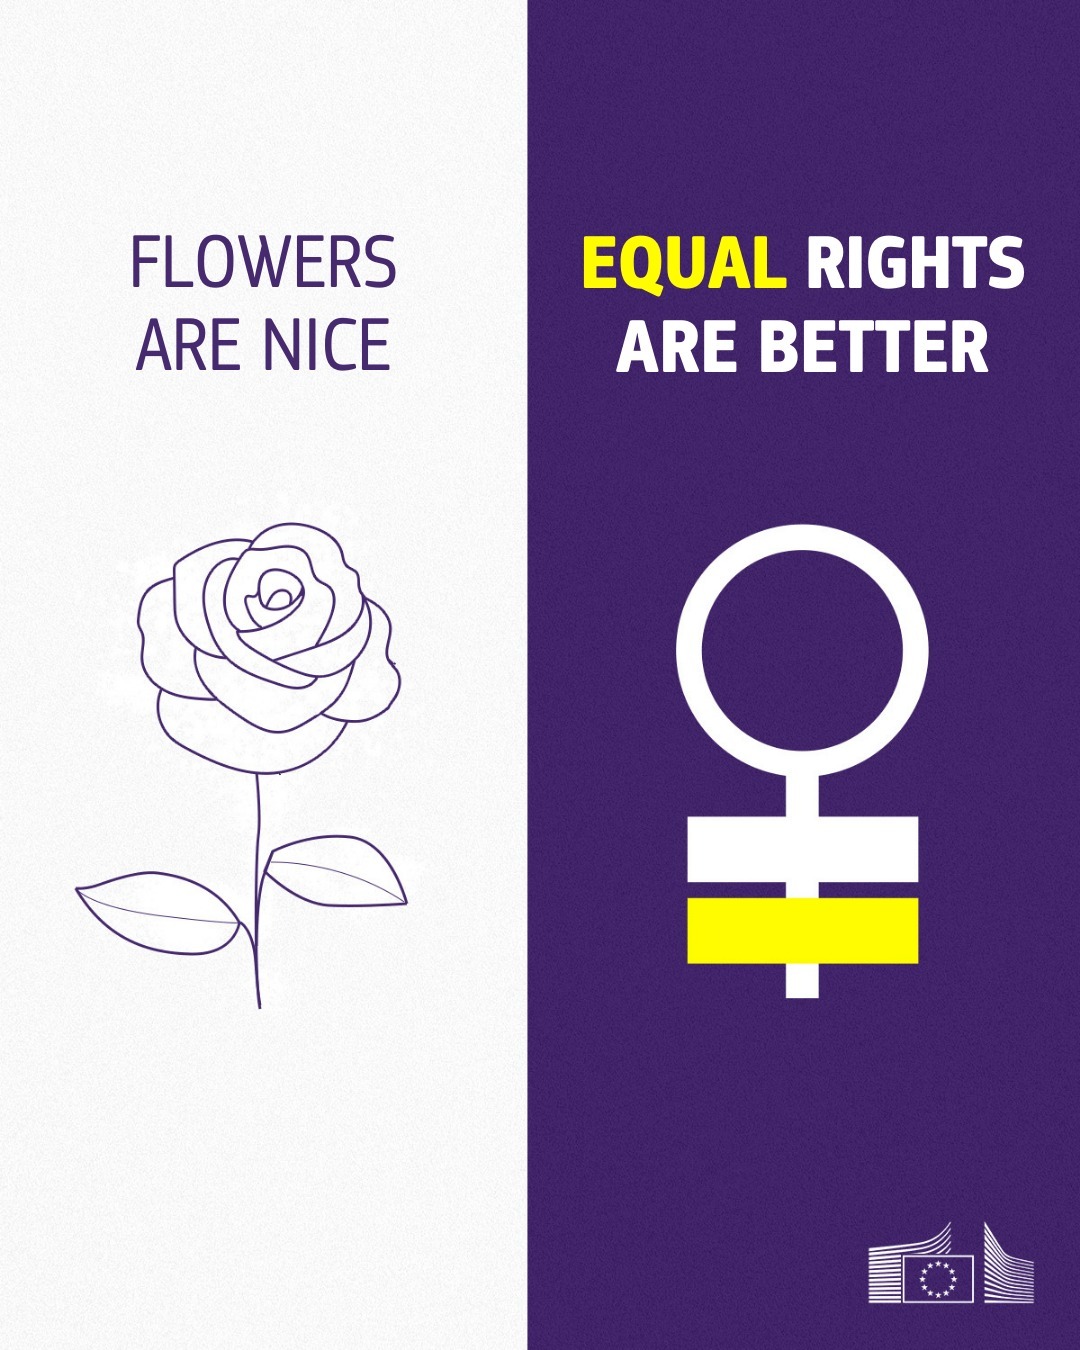
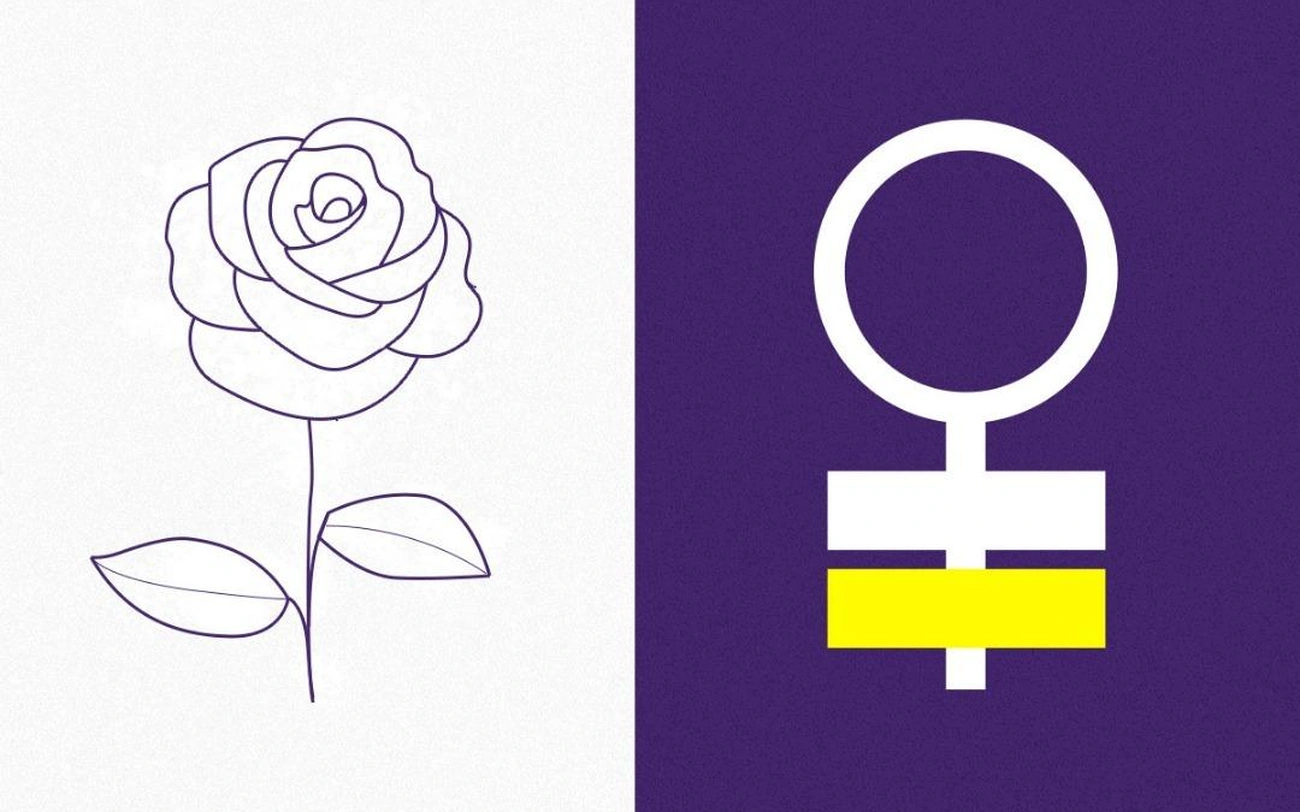
A playful take on the cliché that flowers are what women want, reframing the gesture around something that actually matters: equal rights.
View original postDesign · Animation
2026
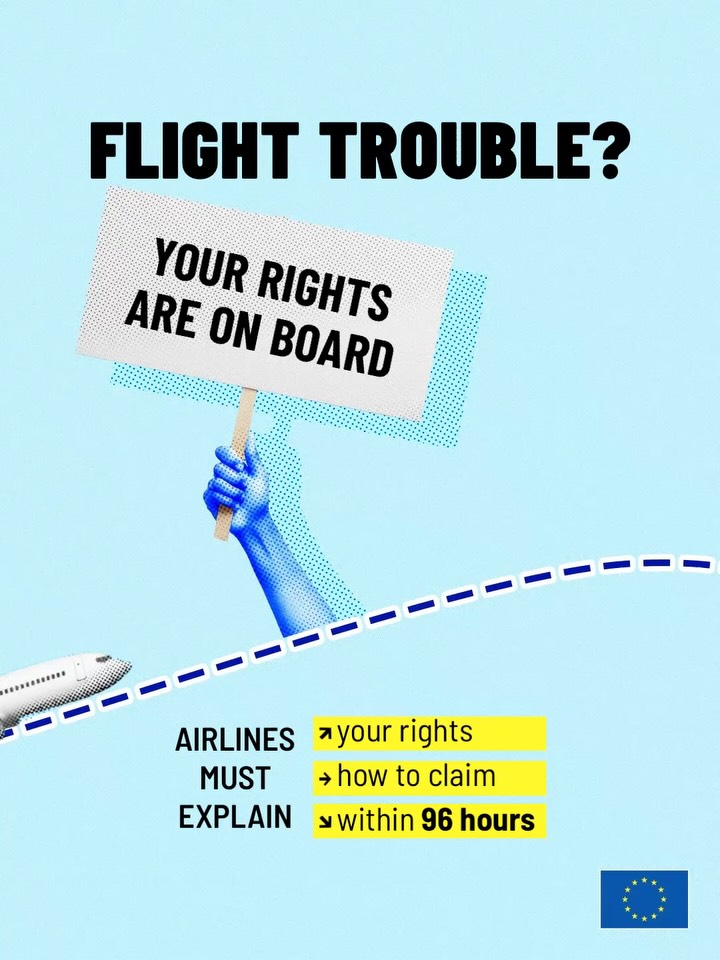
An aeroplane trail and a hand-held placard make passenger rights a direct, recognisable travel message.
View original postIllustration
2026
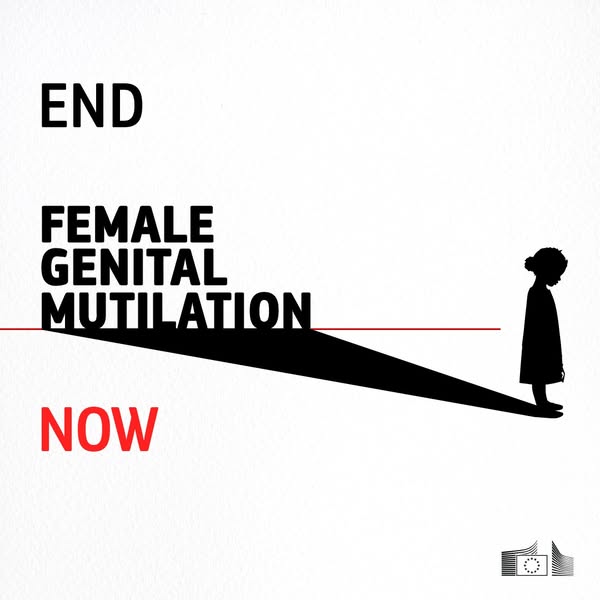
A persistent shadow represents the threat of FGM following girls. The visual conveys vulnerability and harm subtly, avoiding graphic imagery that could cause distress.
View original postConcept · Illustration
2019
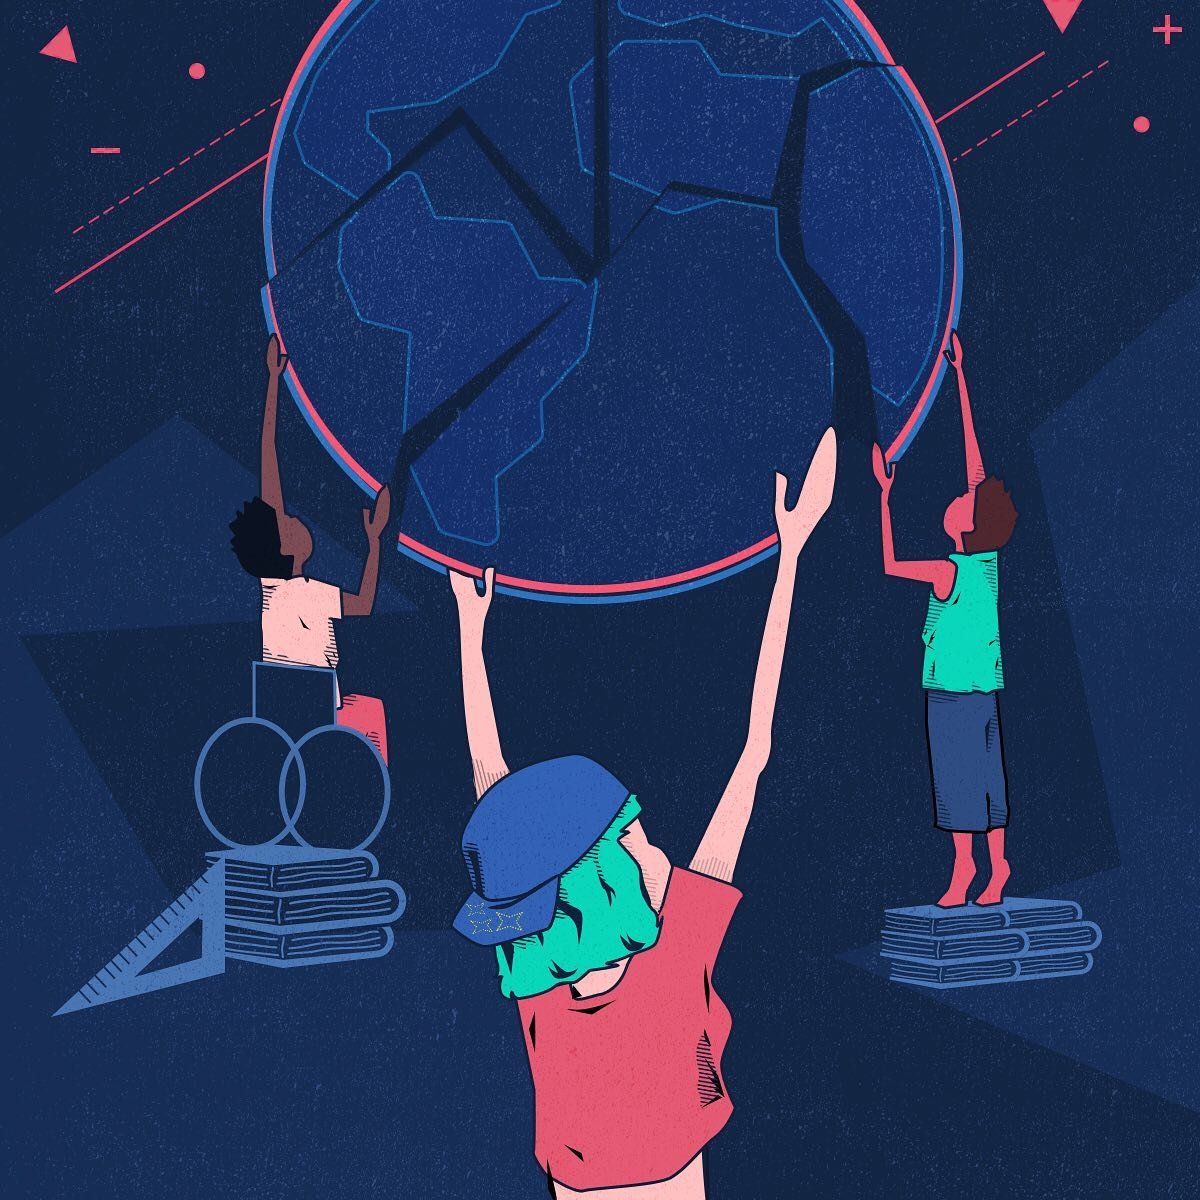
With the right opportunities, resources and support, younger generations can repair and reshape the world. The illustration turns that potential into a planet being rebuilt.
View original postConcept · Design · AI-assisted editing/compositing
2025
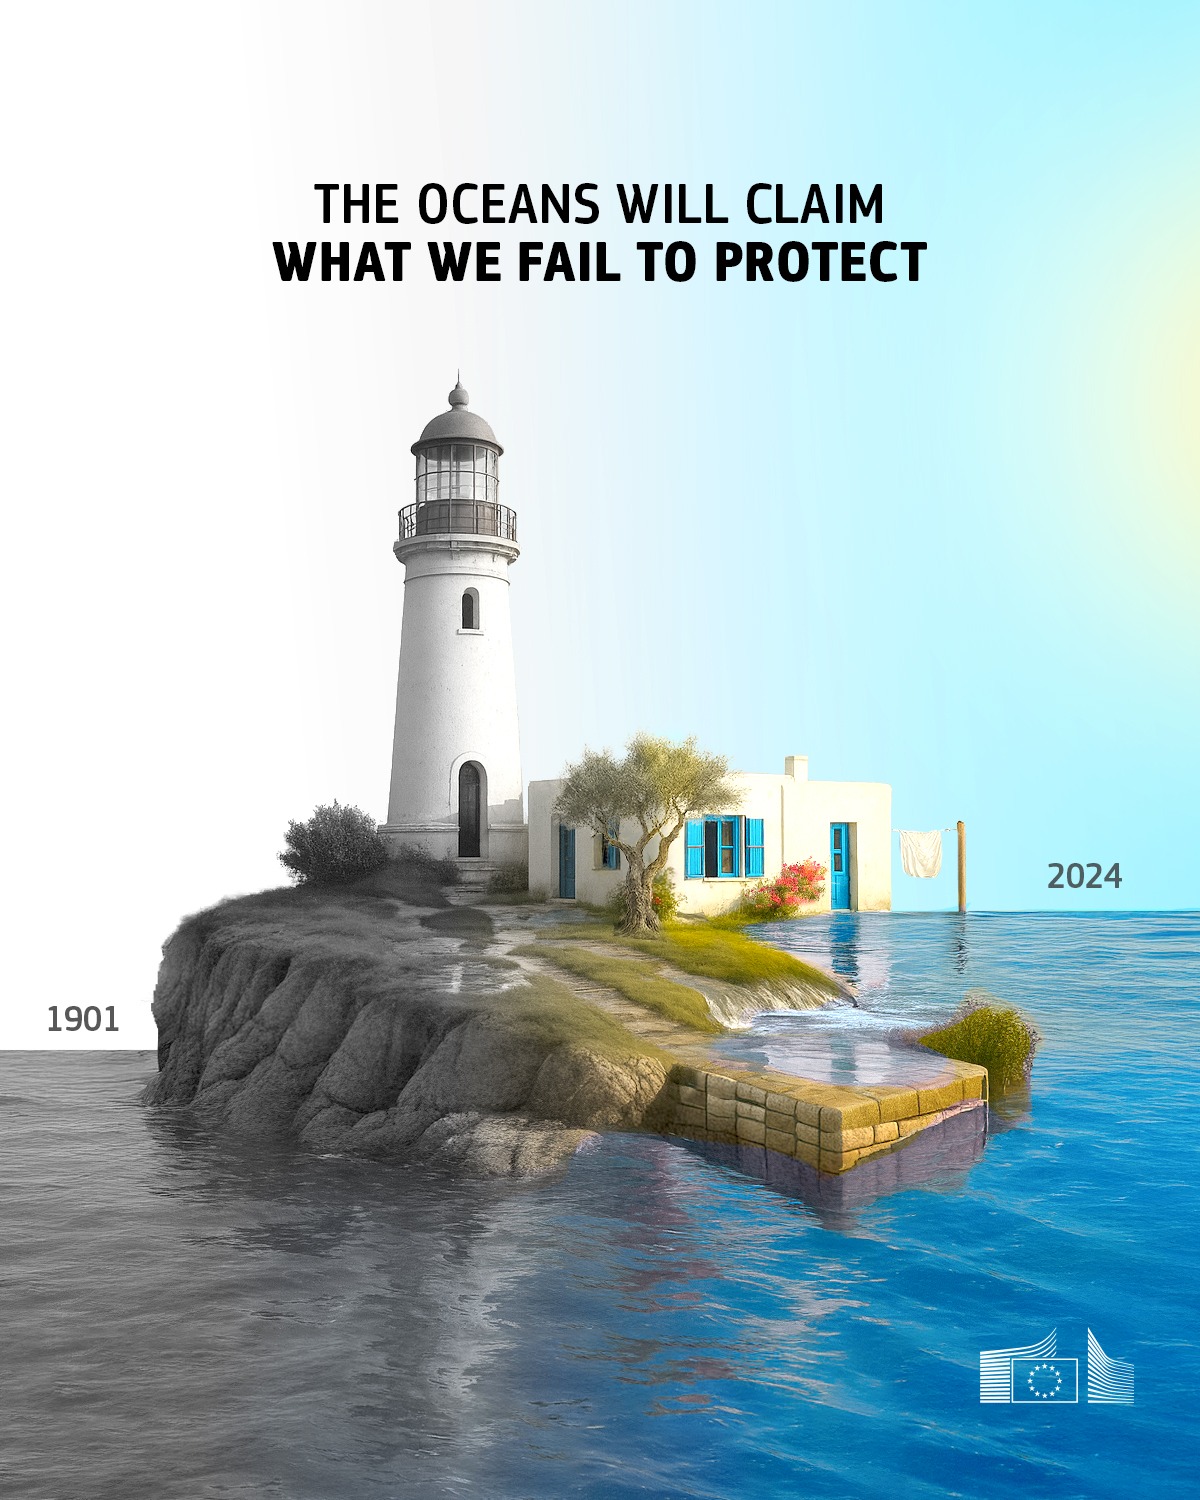
A visually amplified interpretation of rising sea levels, using a simplified data point to create a more immediate and memorable environmental message.
View original post