

How Many Hours a Week Do Europeans Work?
Concept · Data Storytelling · Design
2026
Opening the curtains captures a familiar moment in a long working day: looking outside and waiting for the day to move on.
View original post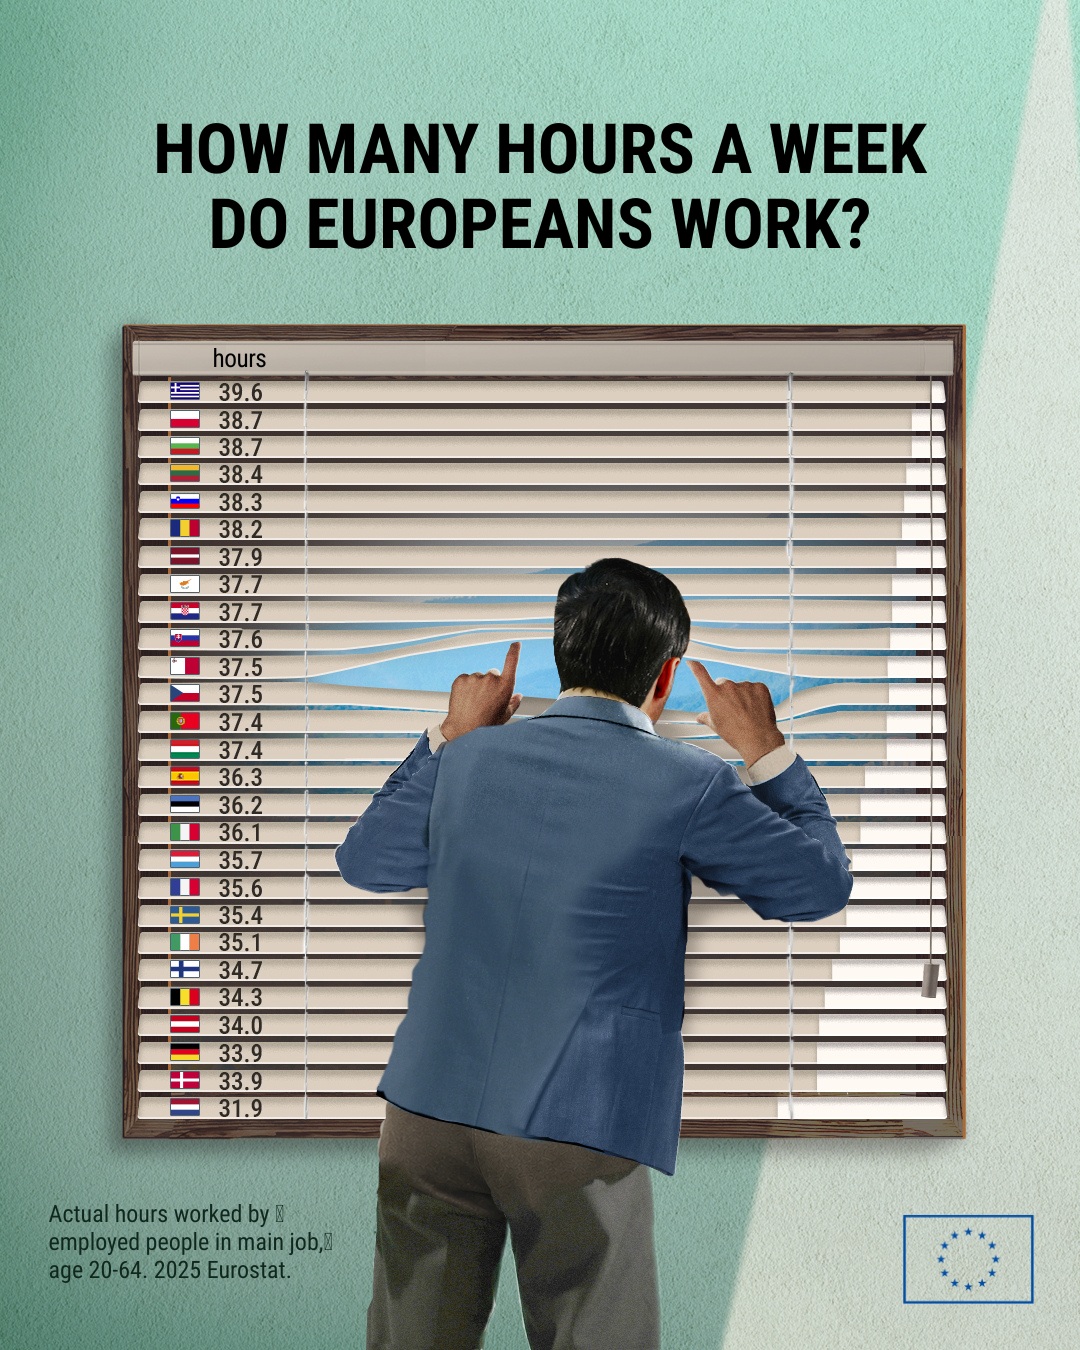

Concept · Data Storytelling · Design
2026
Opening the curtains captures a familiar moment in a long working day: looking outside and waiting for the day to move on.
View original postData Storytelling · Design
2026
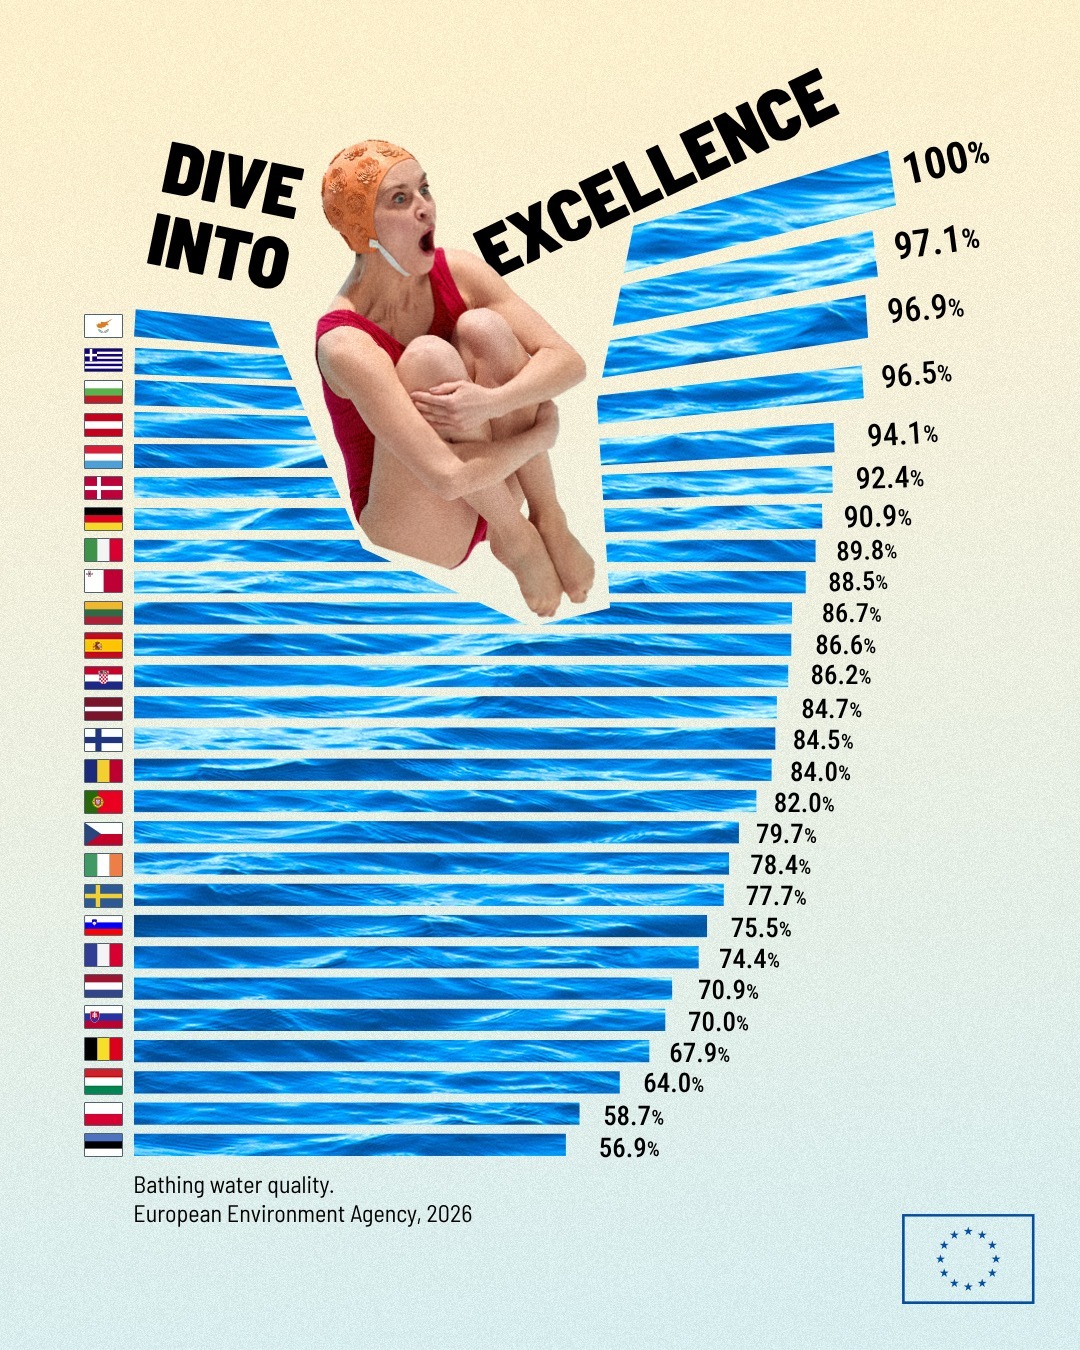
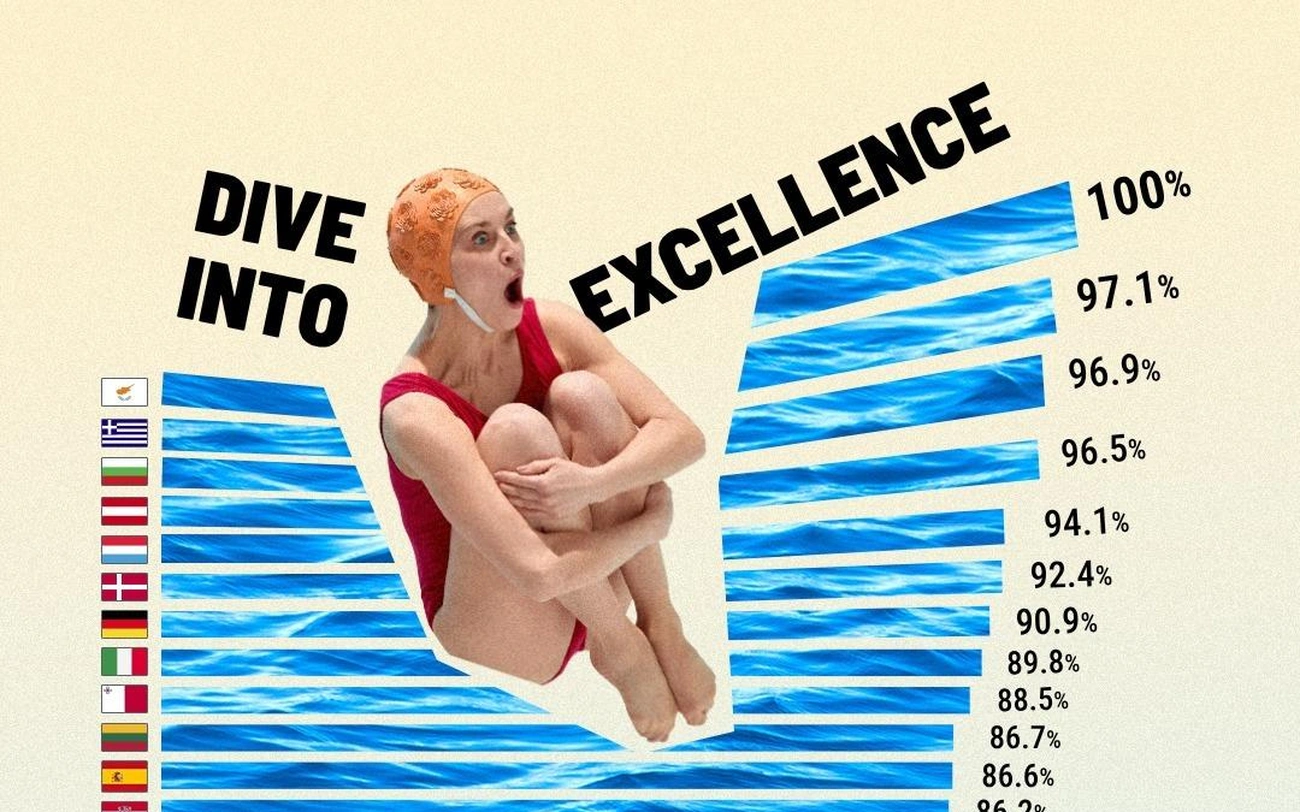
Rigorous bathing-water data becomes an unexpectedly playful chart. A swimmer and disrupted typography break its conventions while keeping the strong scores and 100% values immediately legible, making positive results memorable without compromising accuracy.
View original postData Storytelling · Design
2026
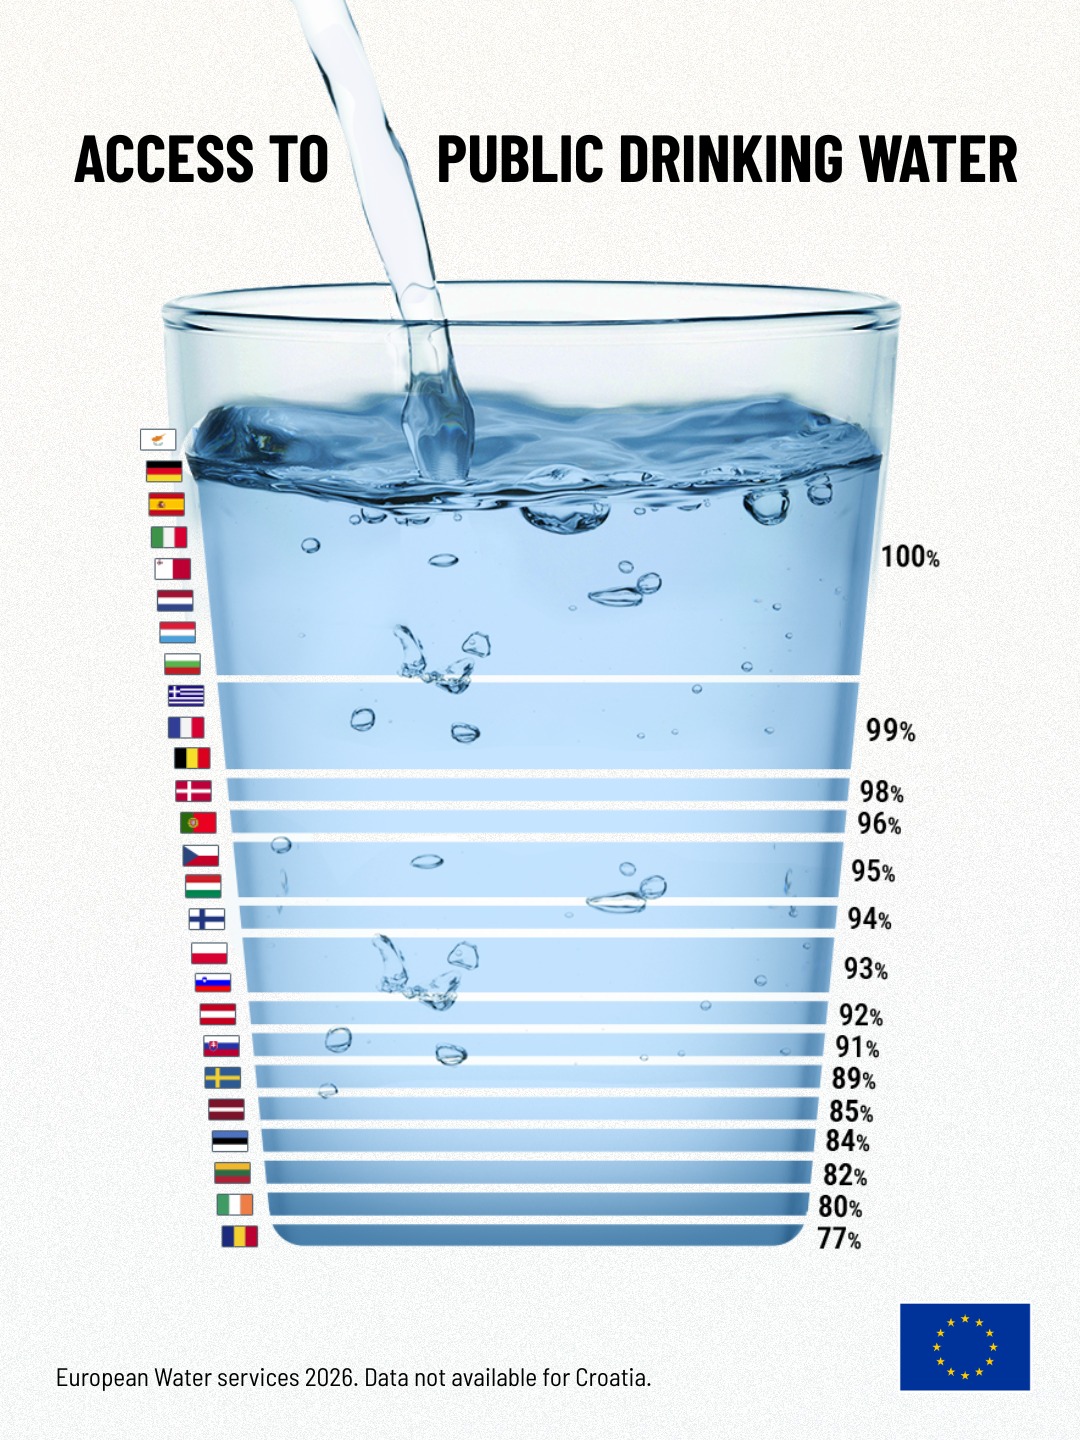
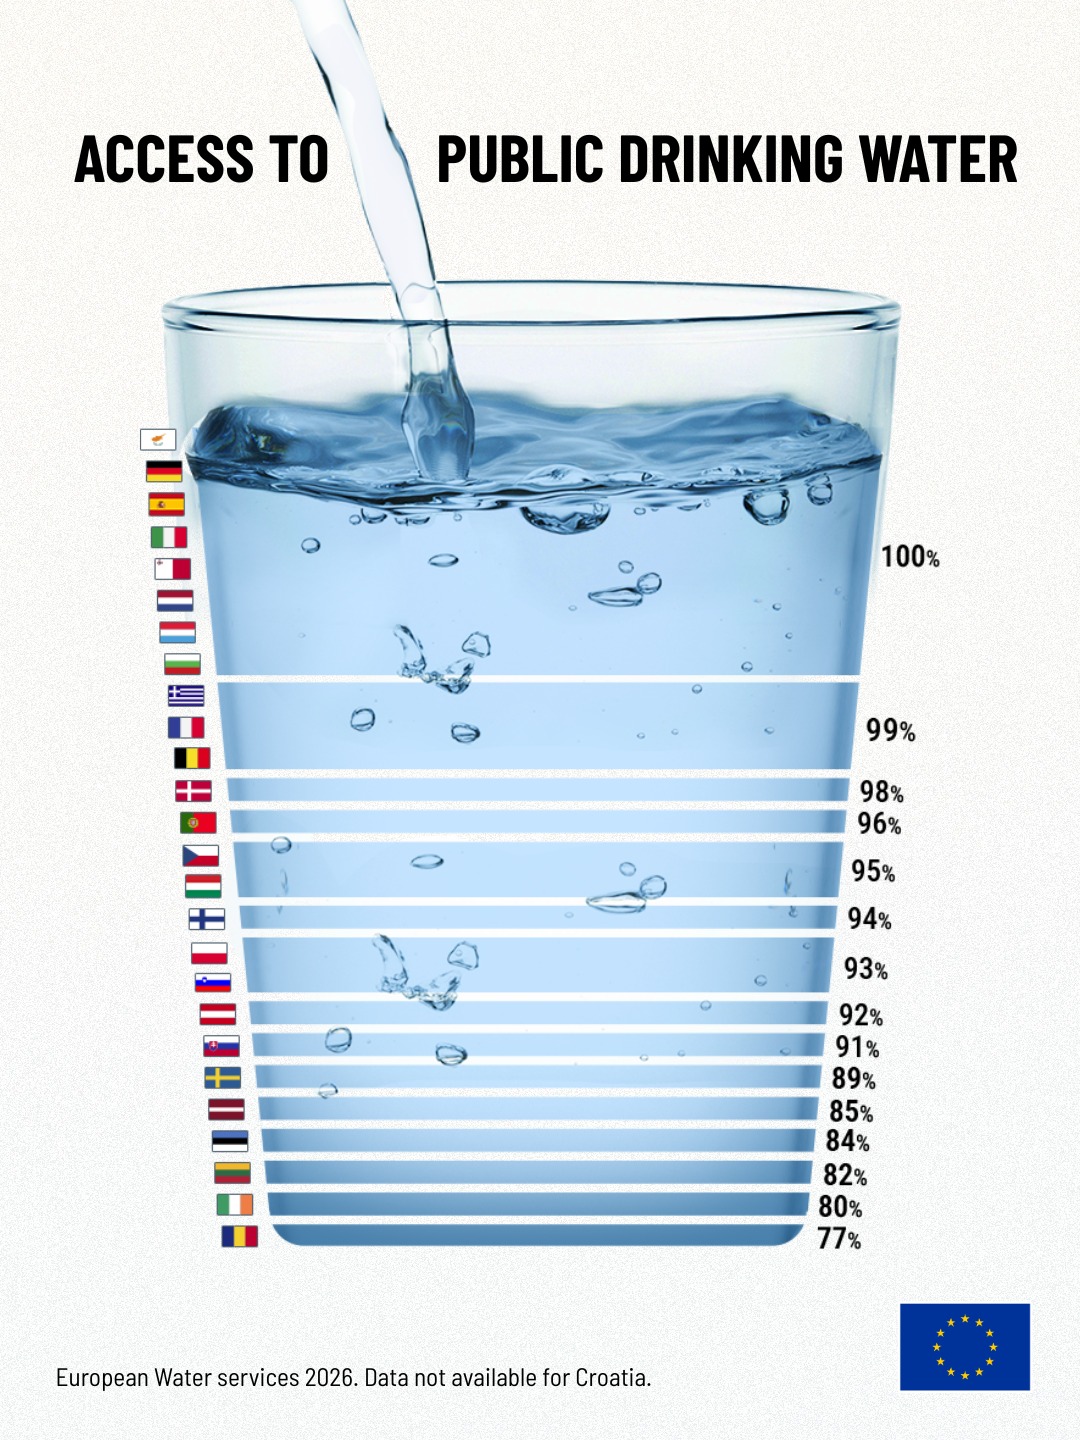
A country comparison designed to make relatively small differences in access visible, highlighting that high percentages can still conceal meaningful gaps in a basic public service.
View original postEUDataCrunch project
Concept · Copy · Data Storytelling · Design
2023
View original postEUDataCrunch project
Concept · Copy · Data Storytelling · Design · Animation
2024
View original postEUDataCrunch project
Concept · Copy · Data Storytelling · Design
2021
View original postEUDataCrunch project
Concept · Copy · Data Storytelling · Design
2021
View original postEUDataCrunch project
Data Storytelling · Design
2021
View original postEUDataCrunch project
Concept · Copy · Data Storytelling · Design
2022
View original postEUDataCrunch project
Concept · Copy · Data Storytelling · Design
2022
View original postEUDataCrunch project
Concept · Copy · Data Storytelling · Design
2022
View original postEUDataCrunch project
Concept · Copy · Data Storytelling · Design
2023
View original postEUDataCrunch project
Concept · Copy · Data Storytelling · Design · Storyboarding
2023
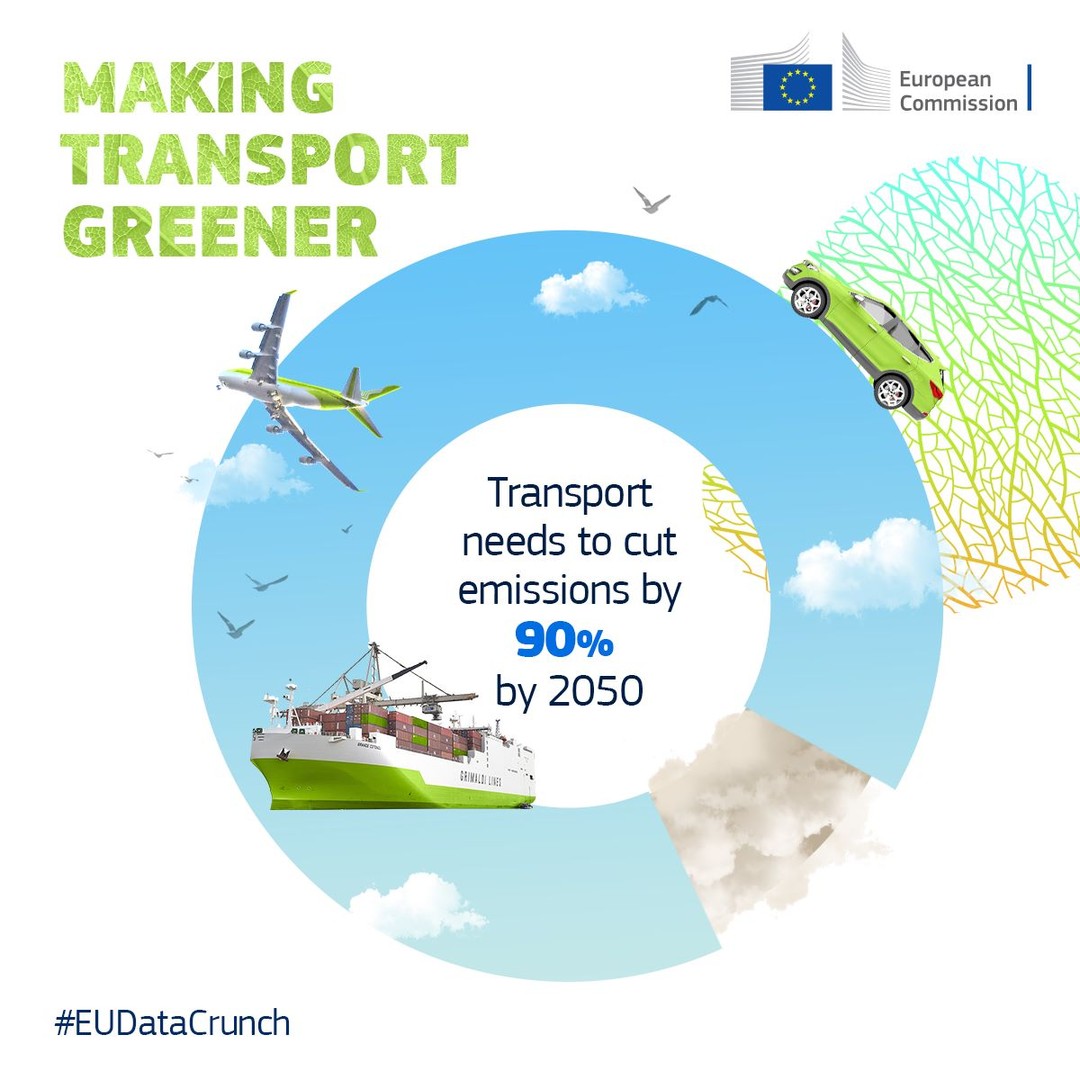
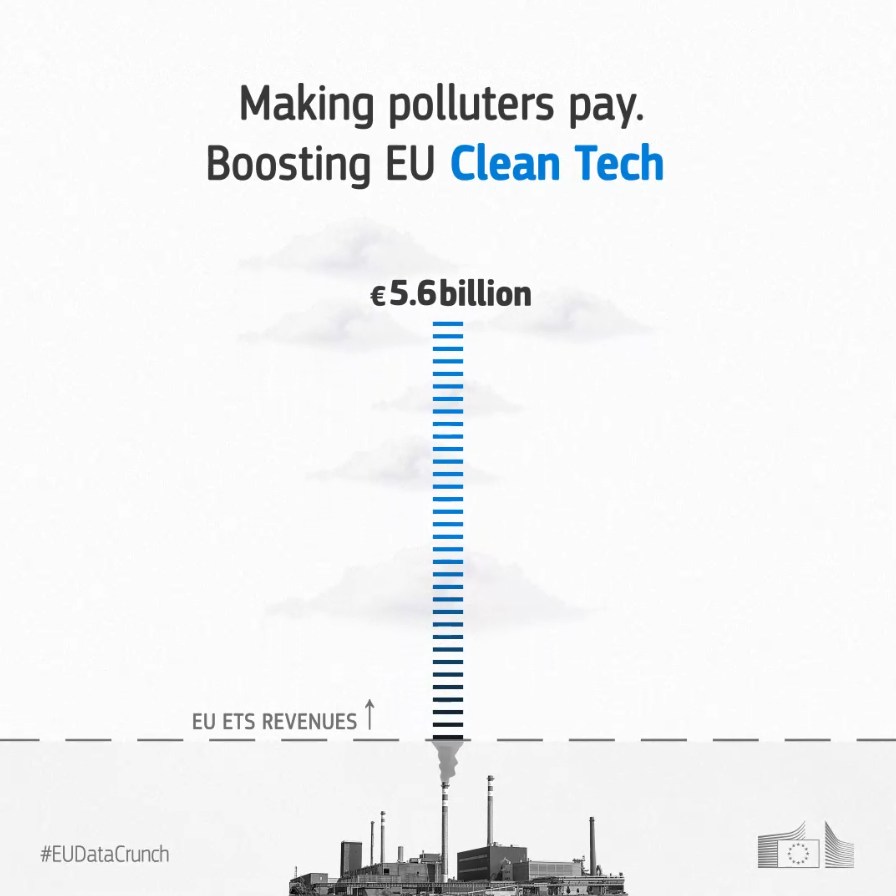
Translating a complex carbon-pricing mechanism into a visual sequence, connecting EU ETS revenues with clean-tech investment, projected avoided CO₂e and a final real-world emissions equivalence.
View original postEUDataCrunch project
Concept · Copy · Data Storytelling · Design
2021
View original postEUDataCrunch project
Data Storytelling · Design
2021
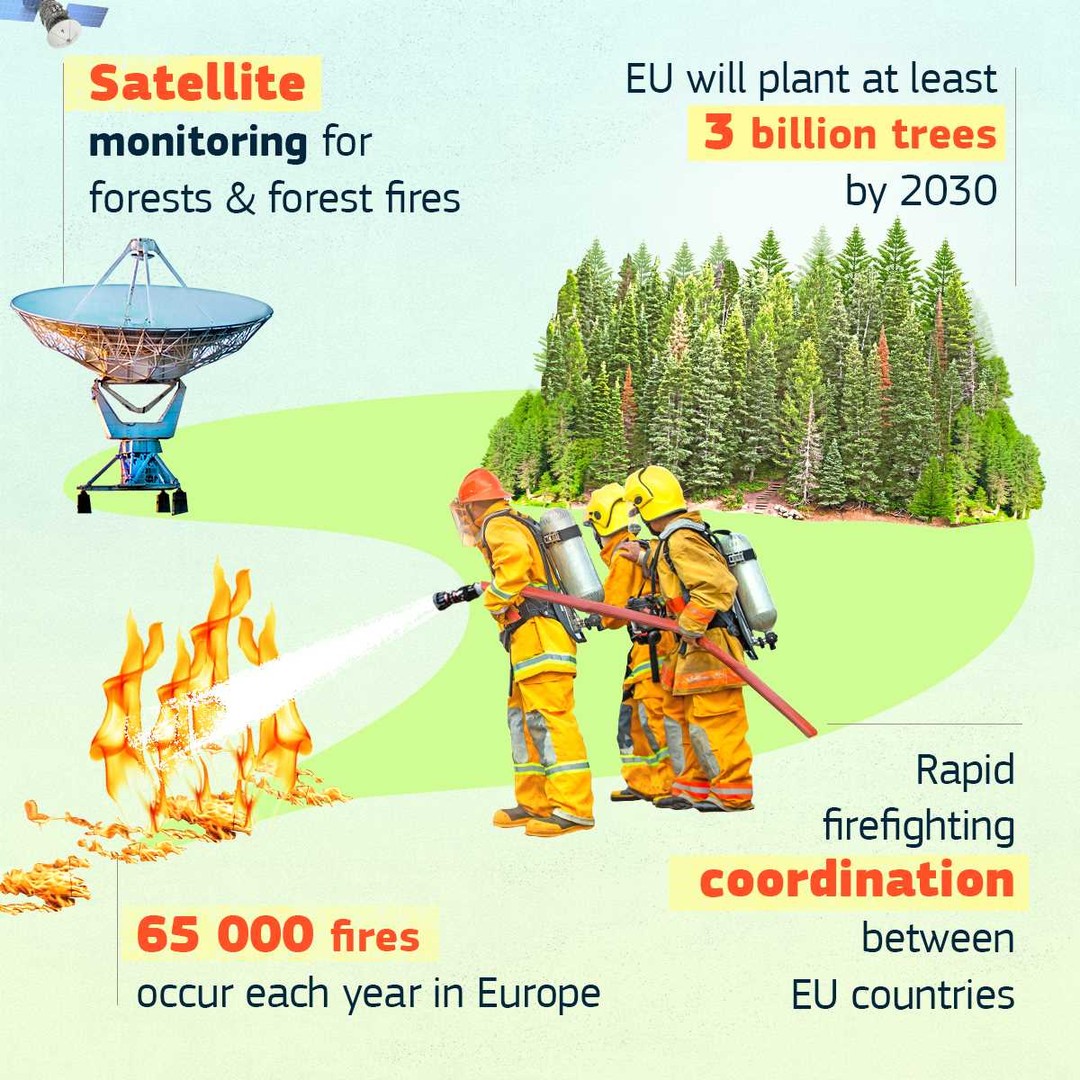
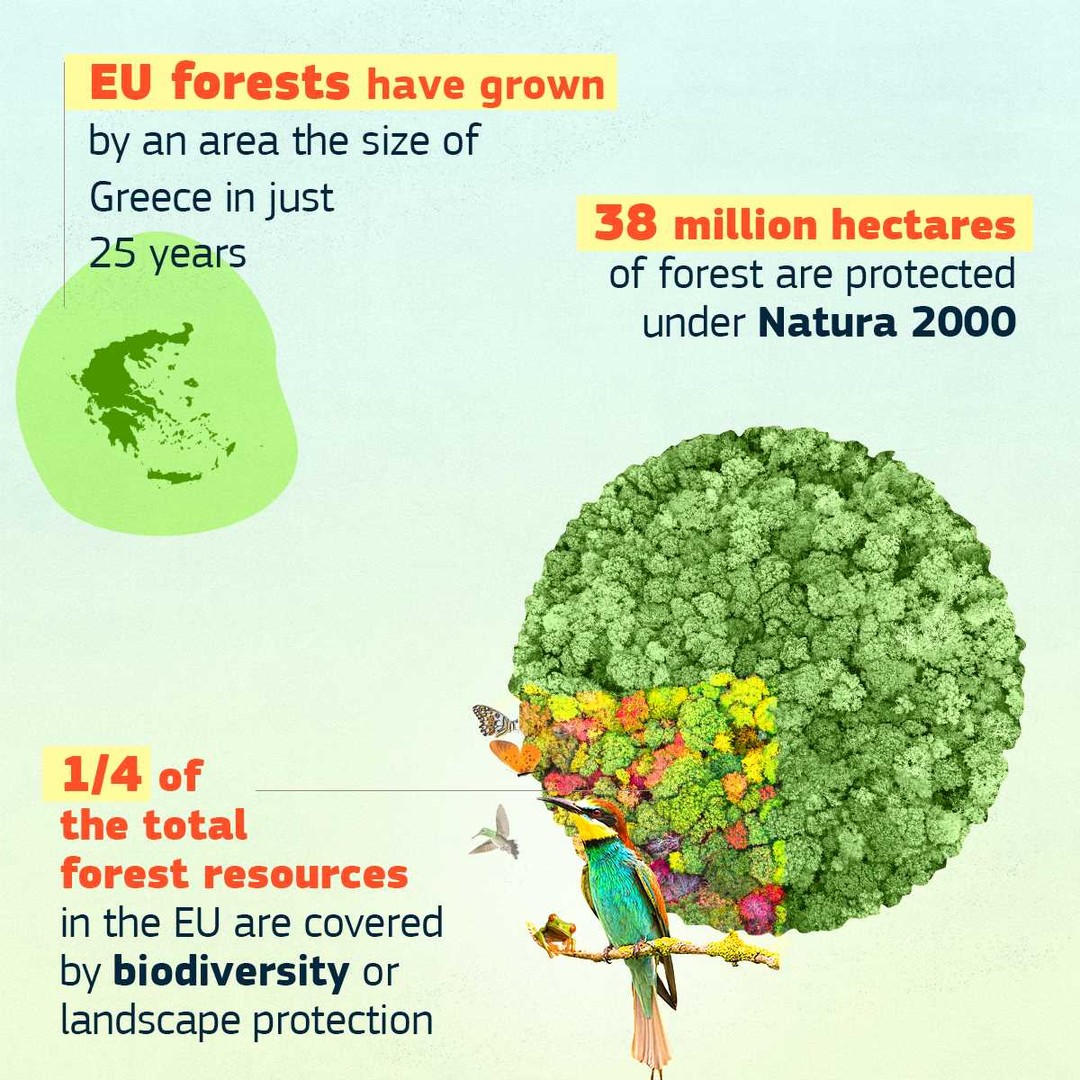
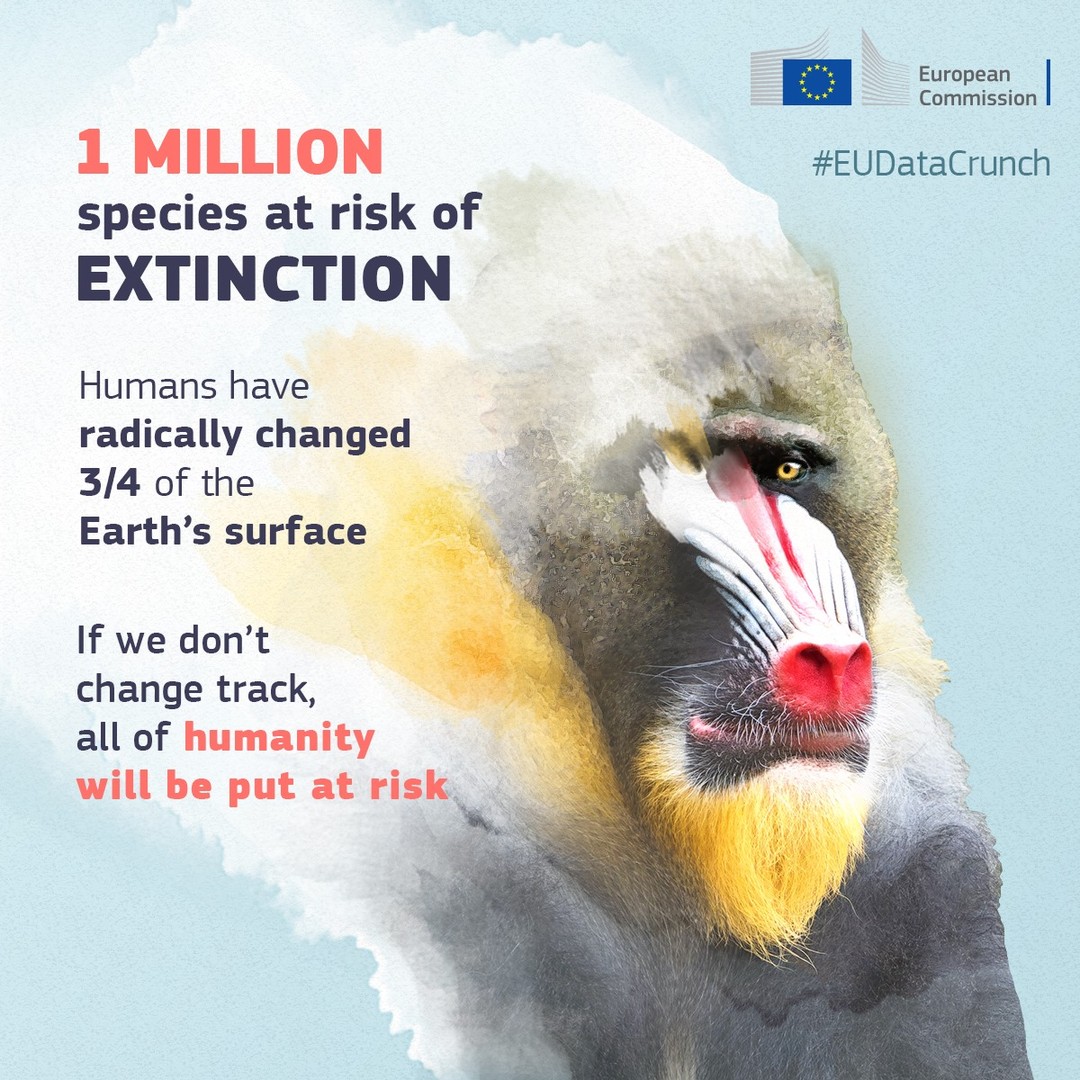
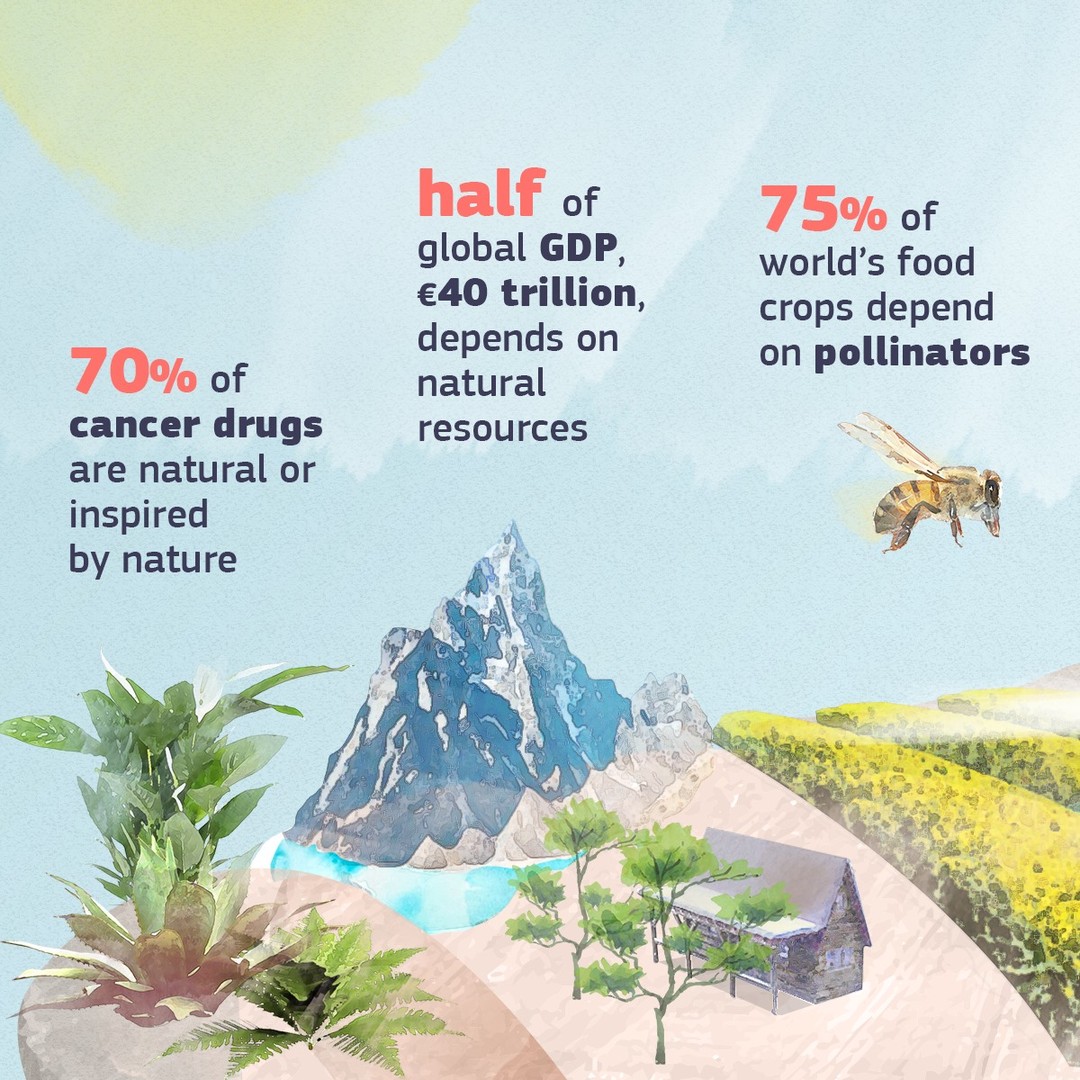
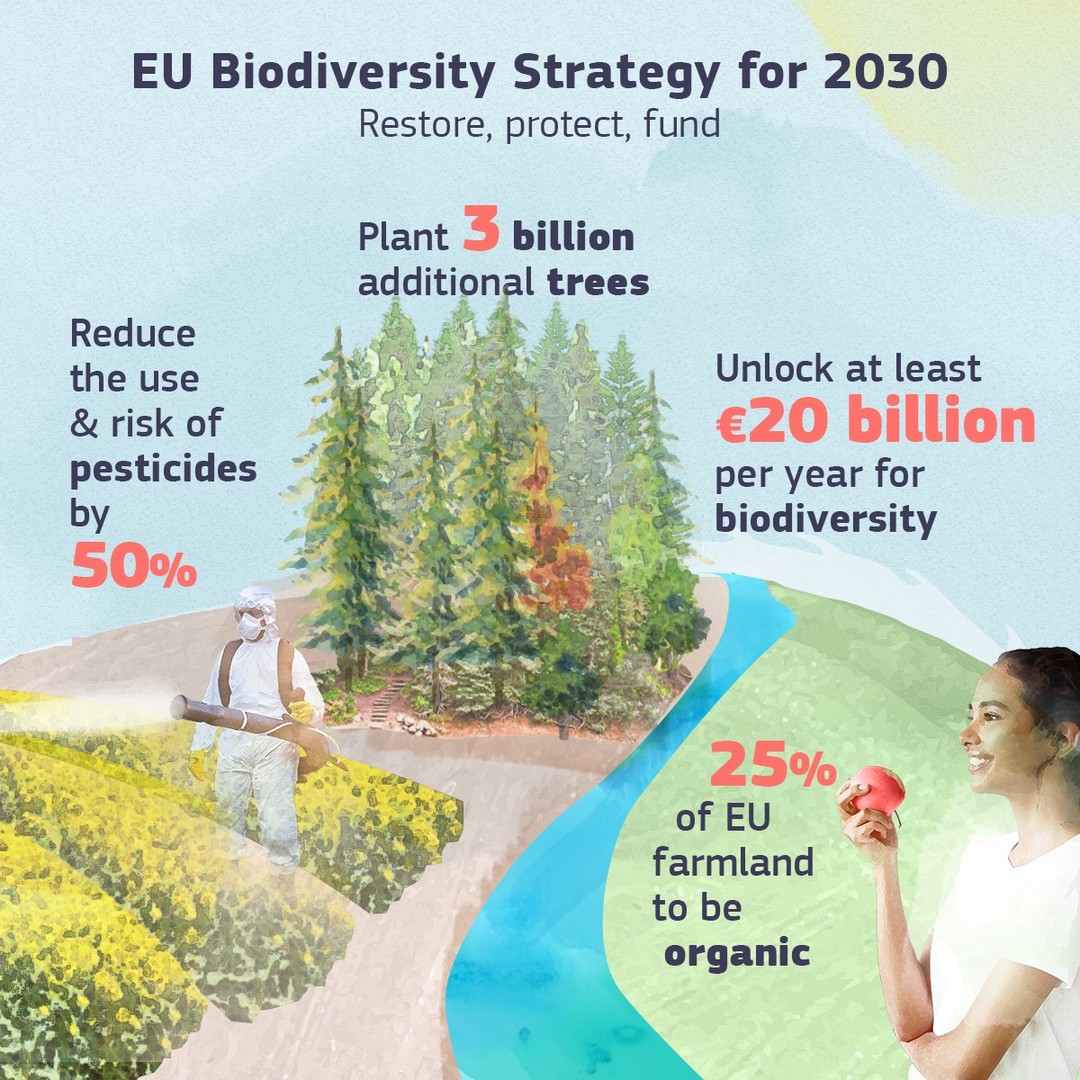
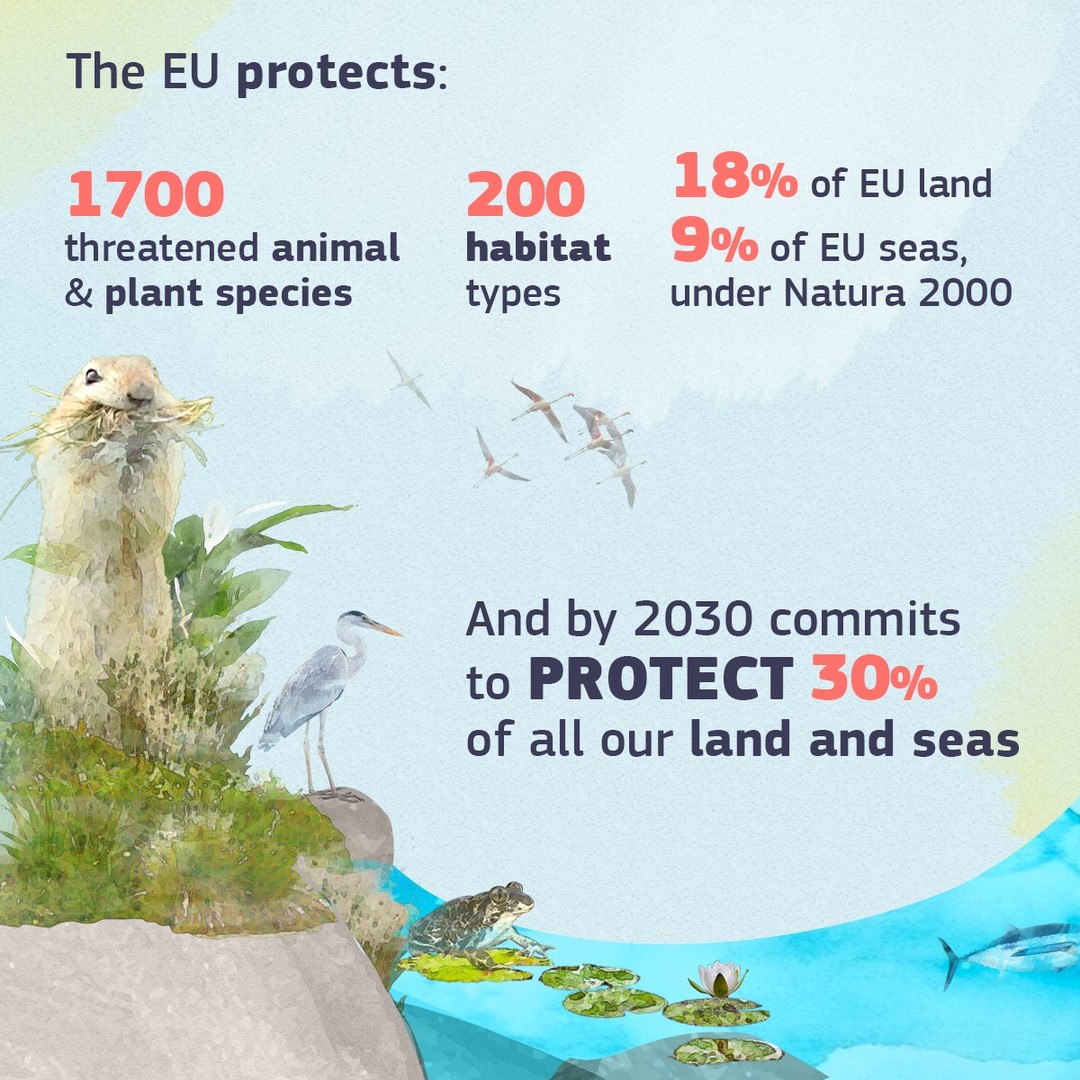
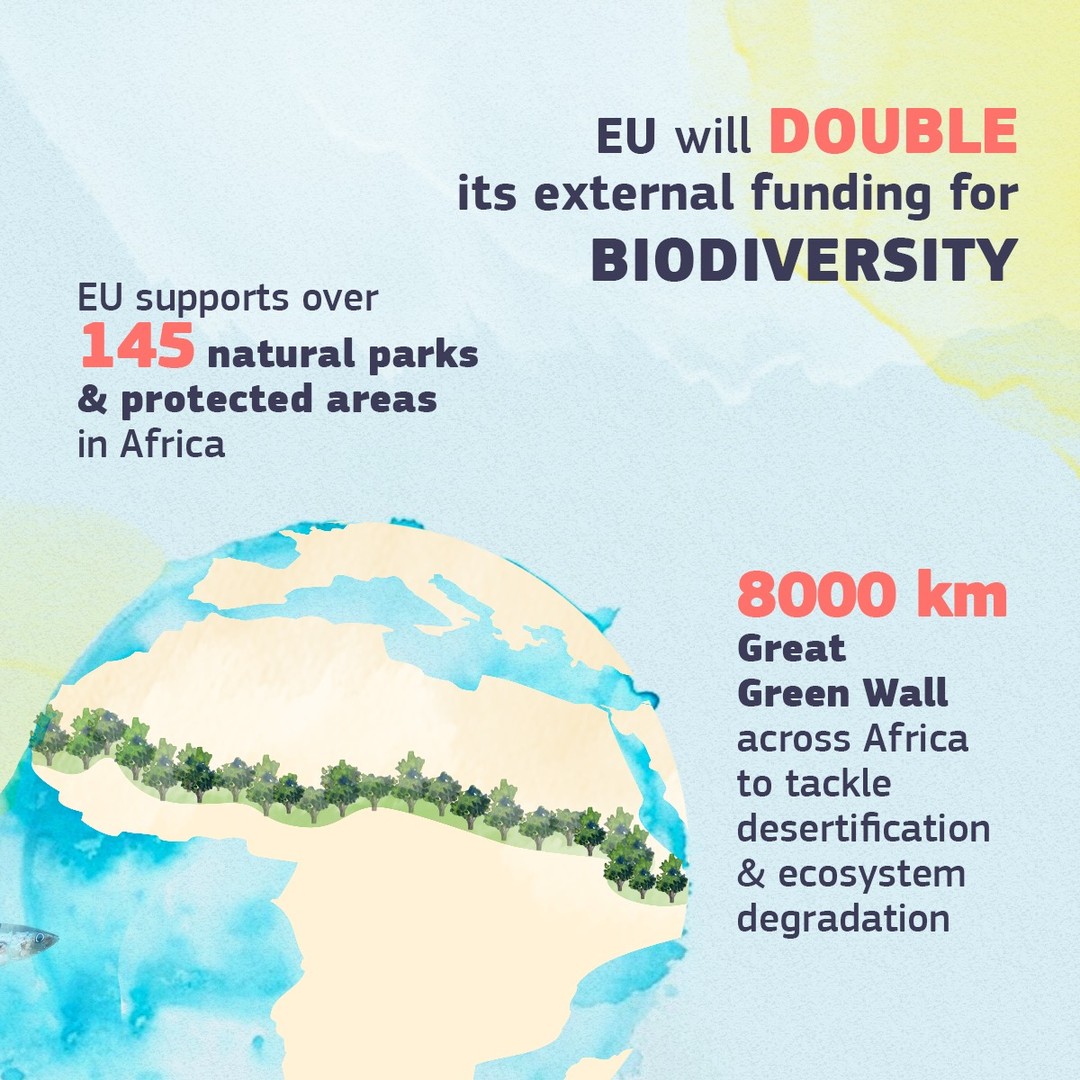
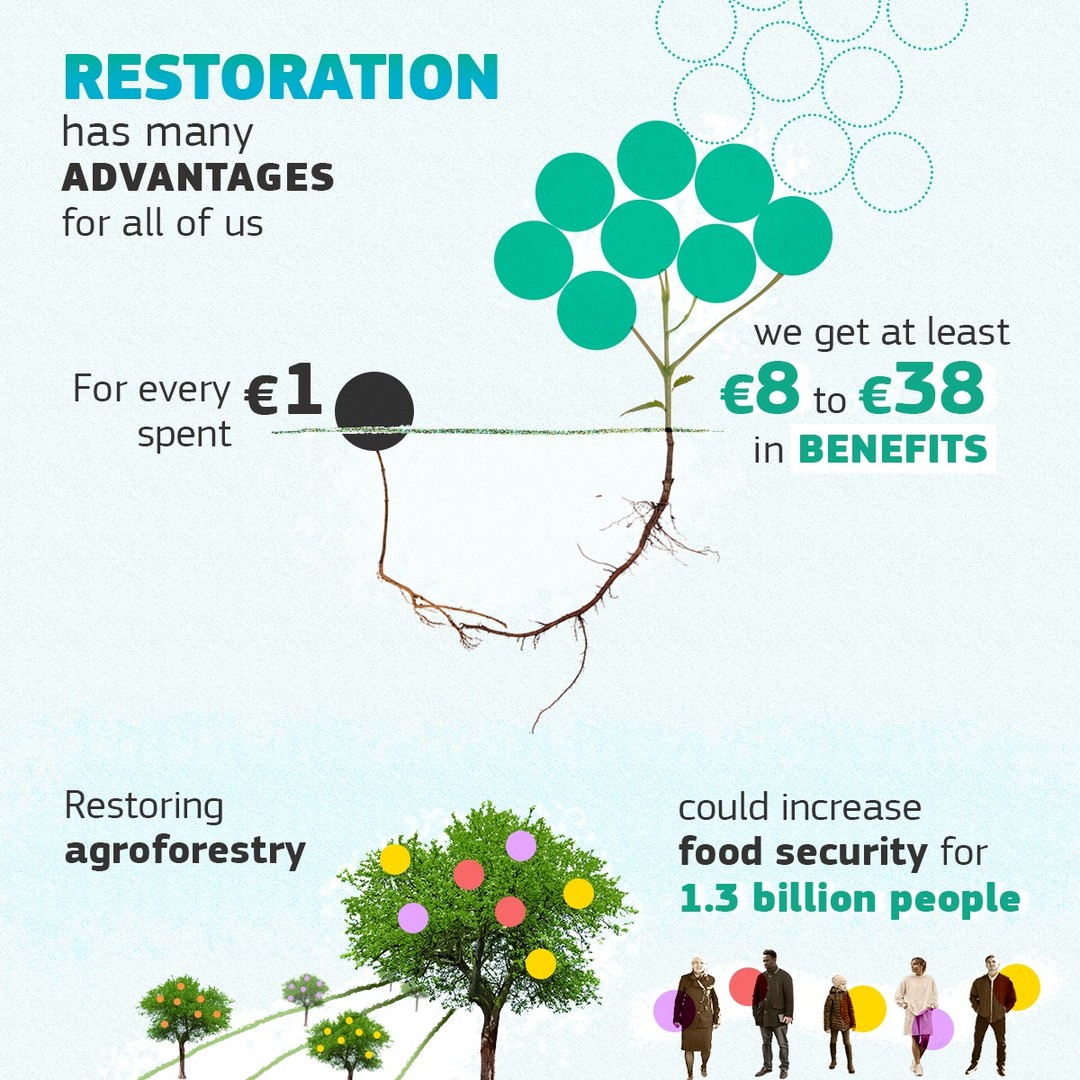
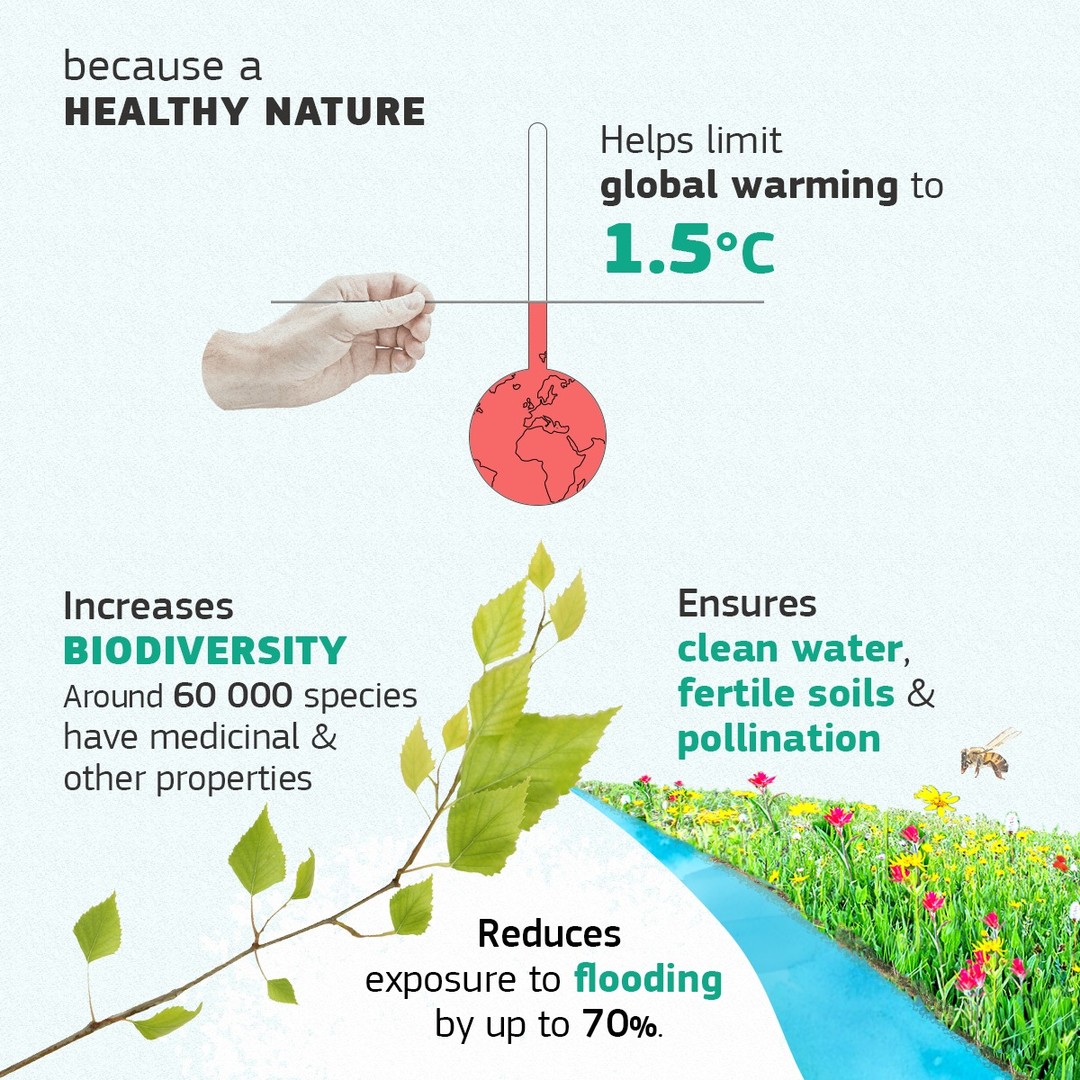
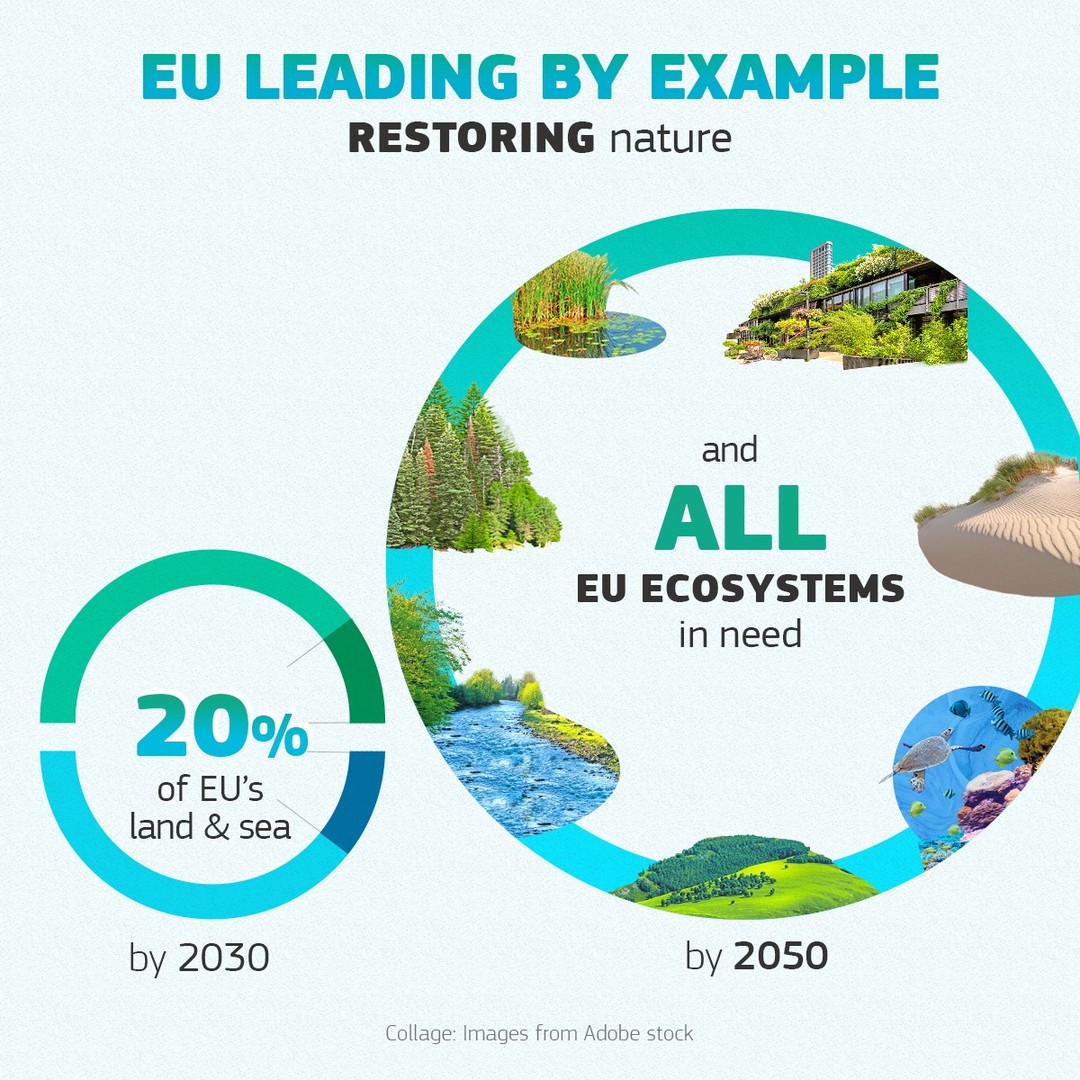
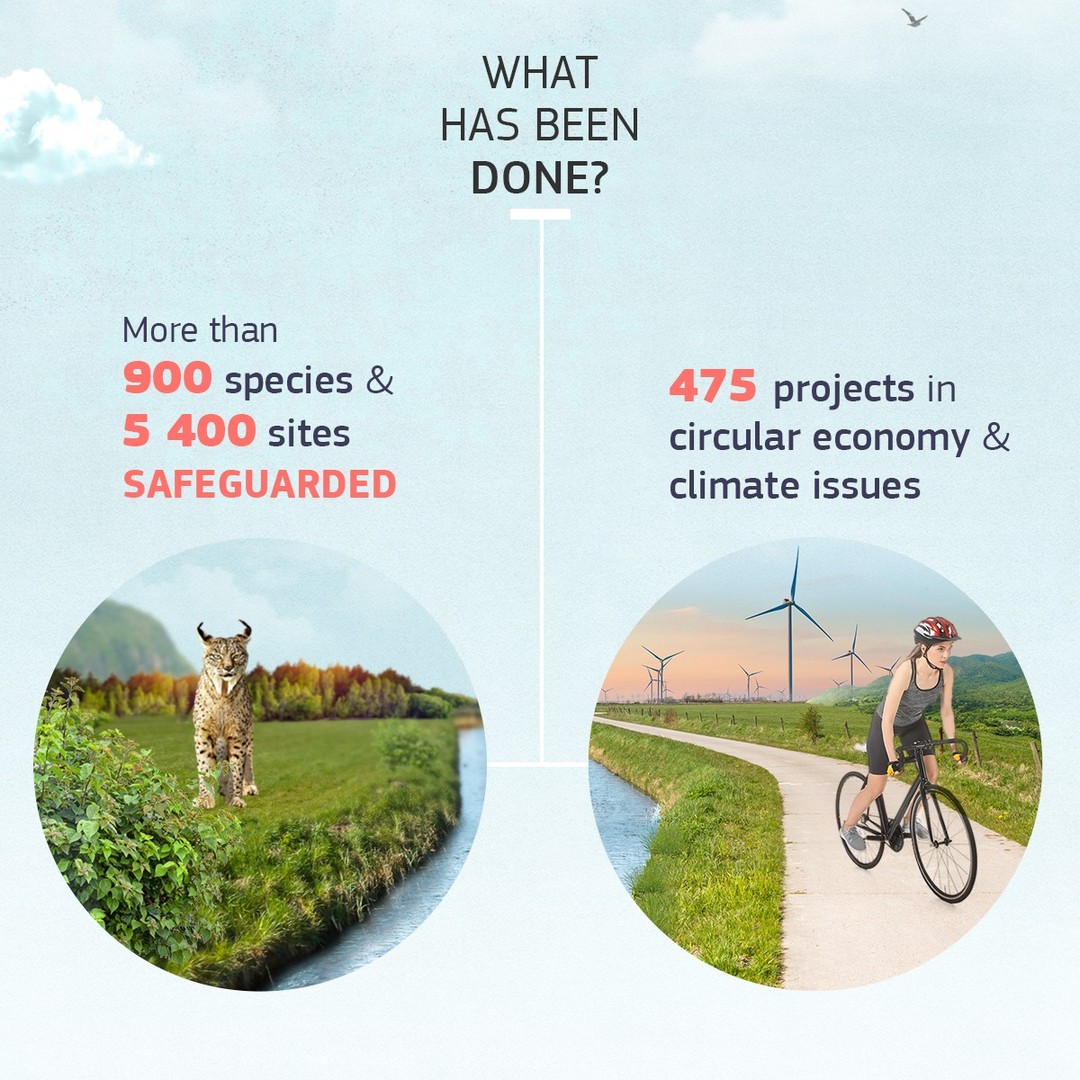
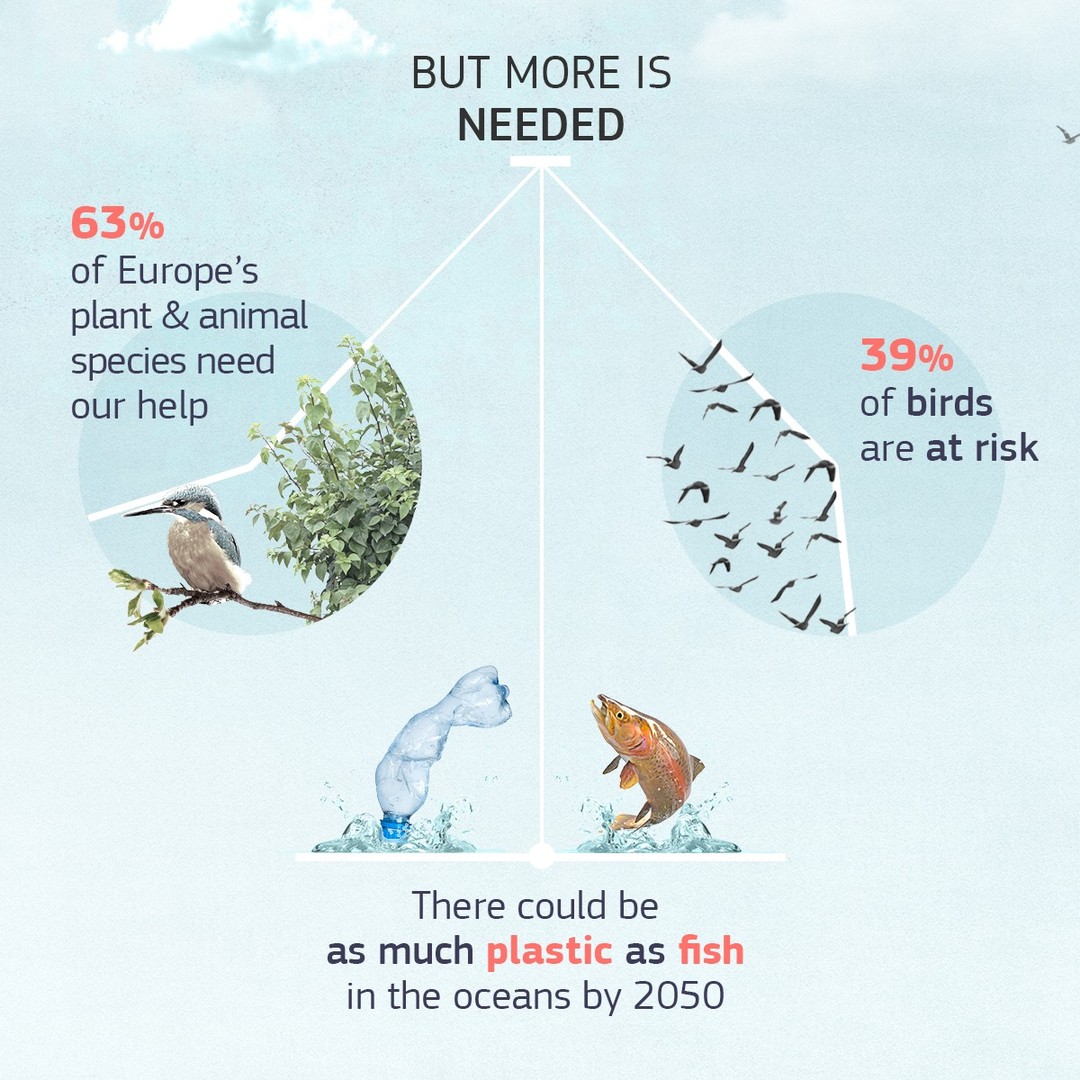
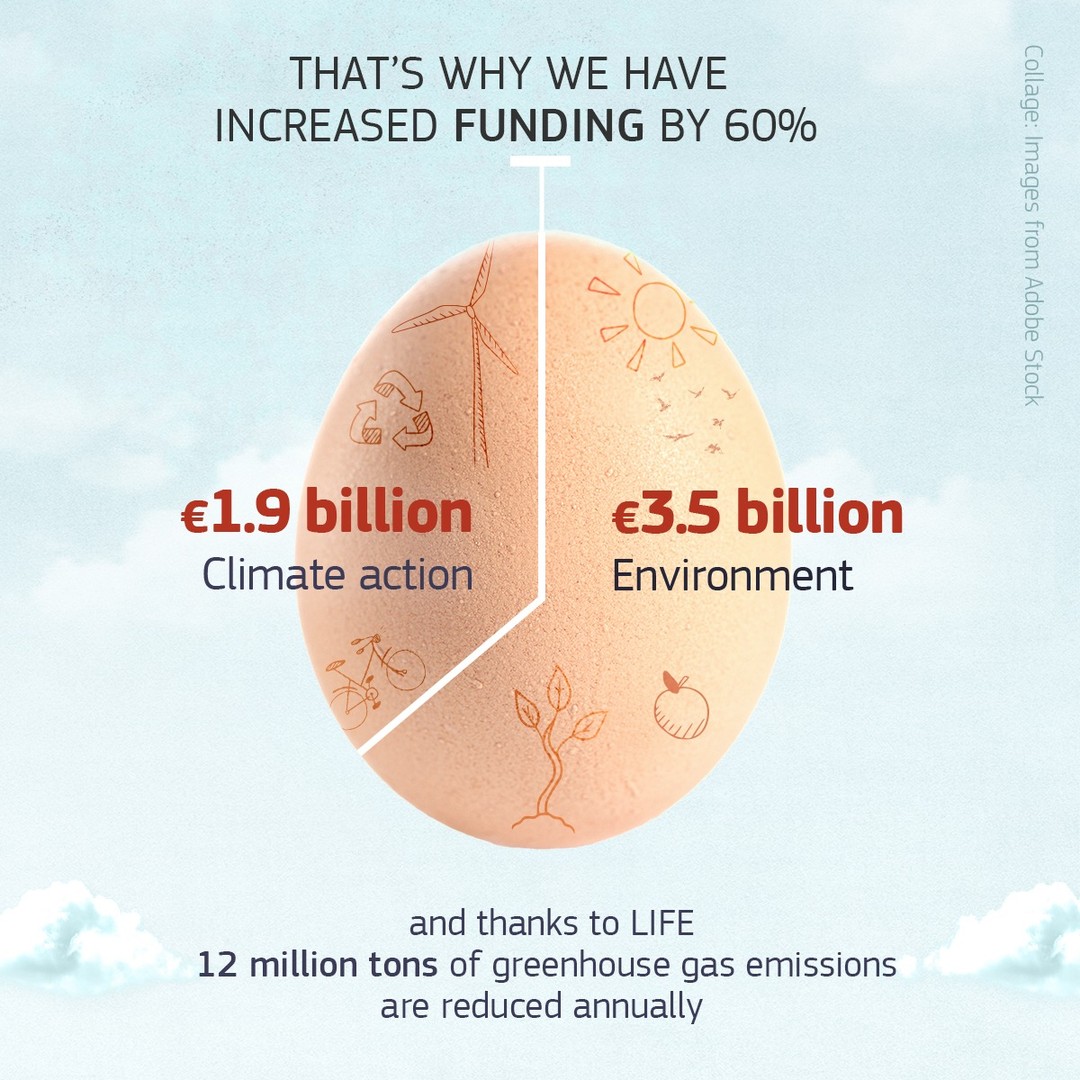
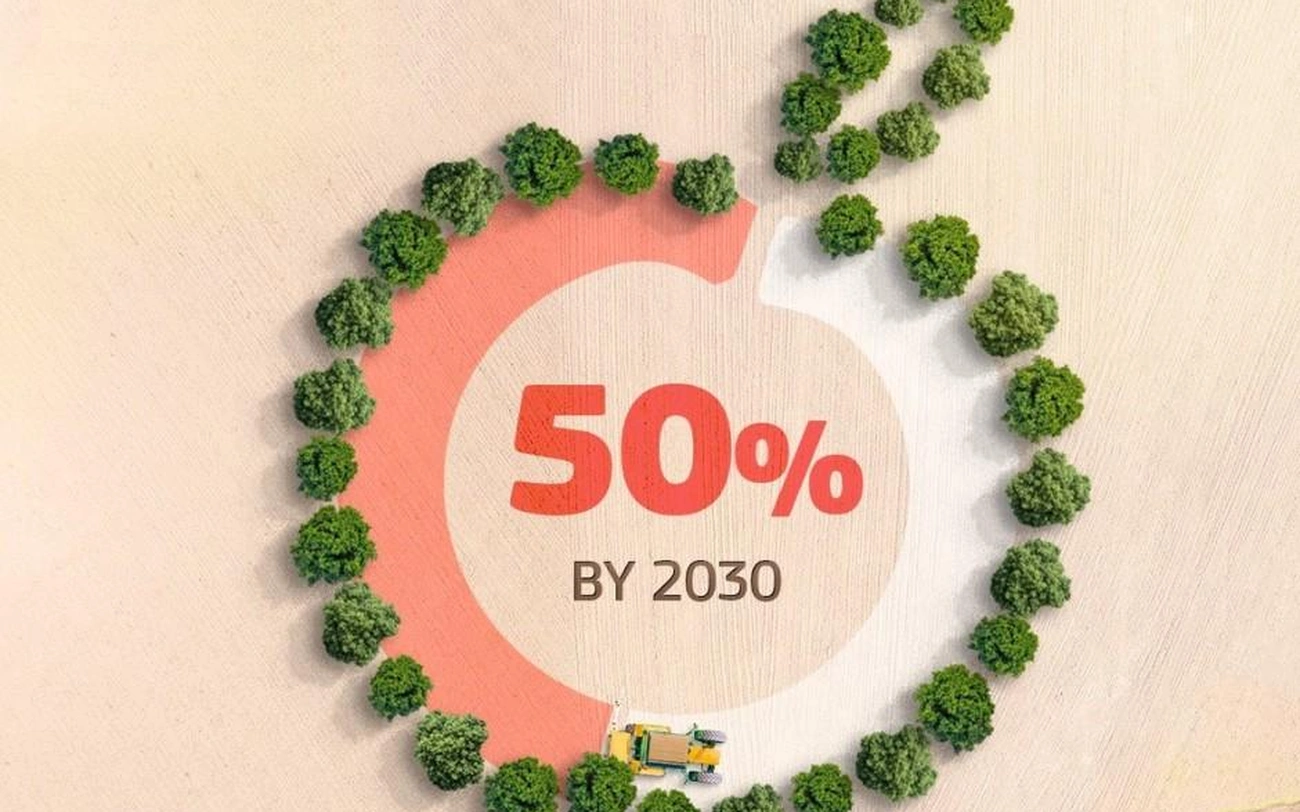
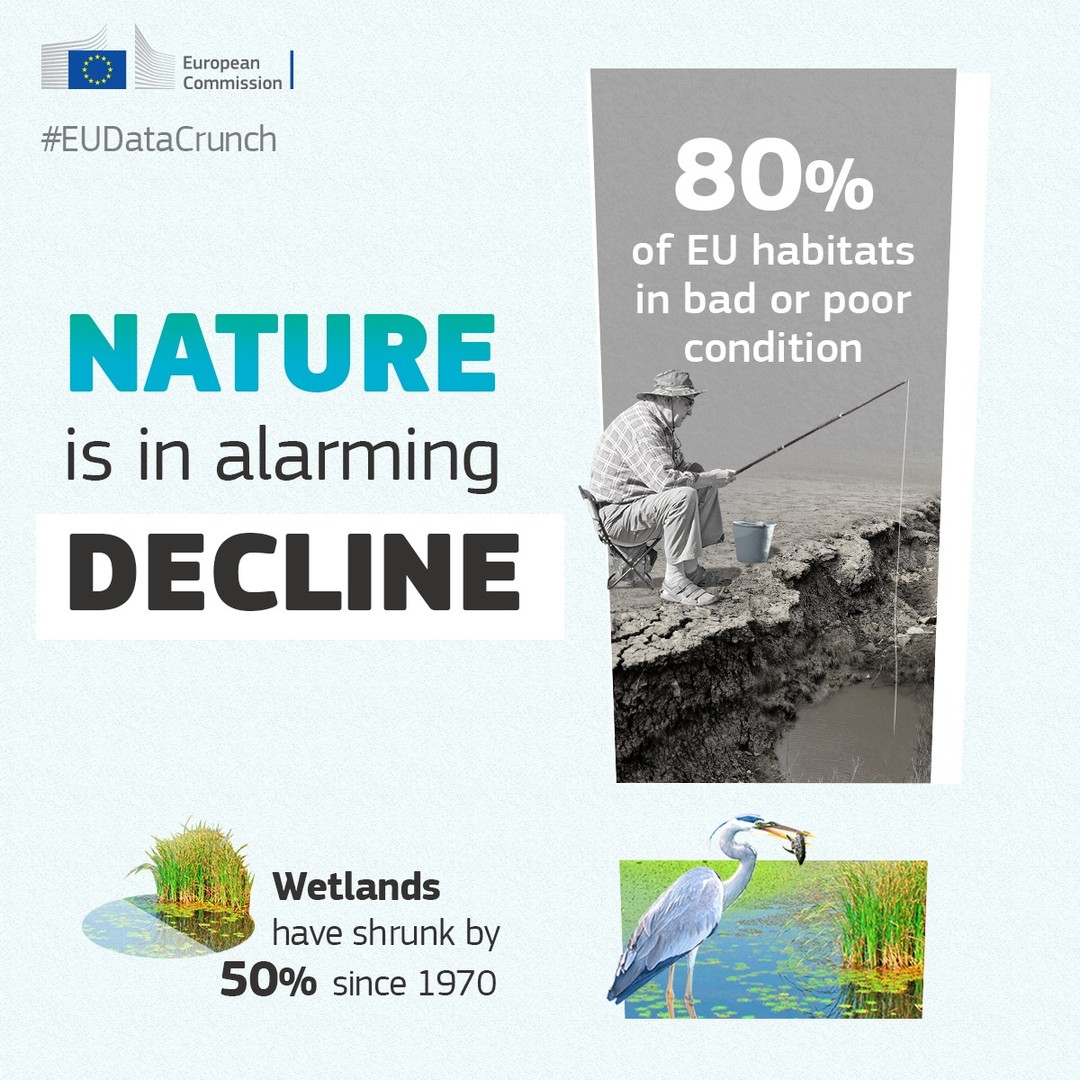
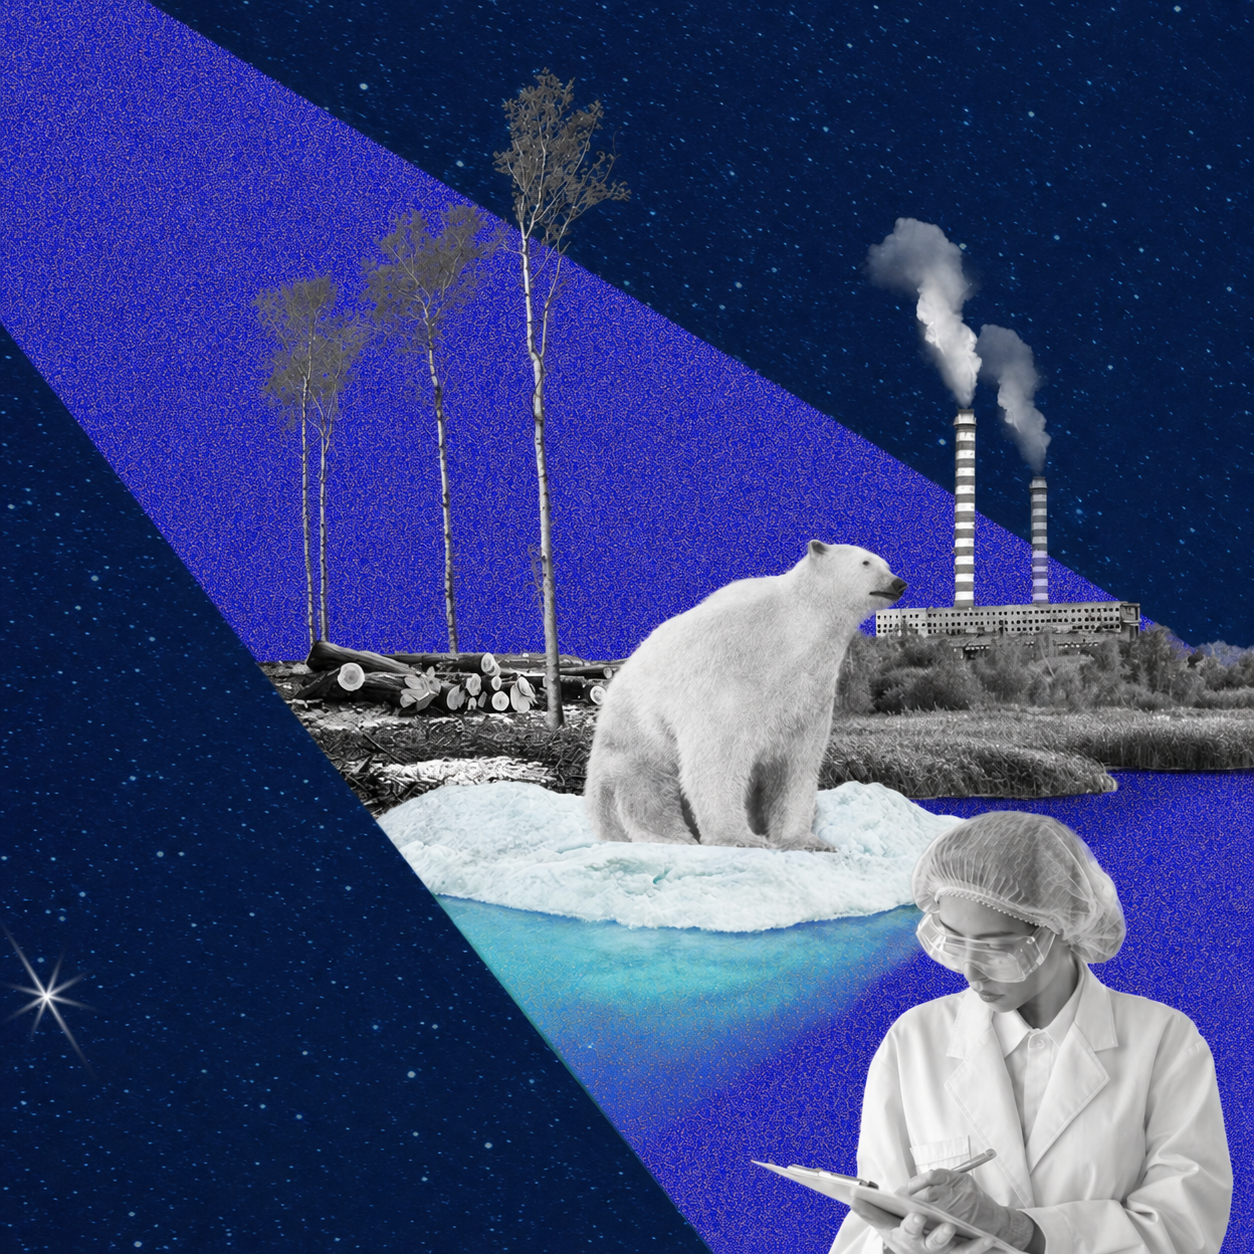
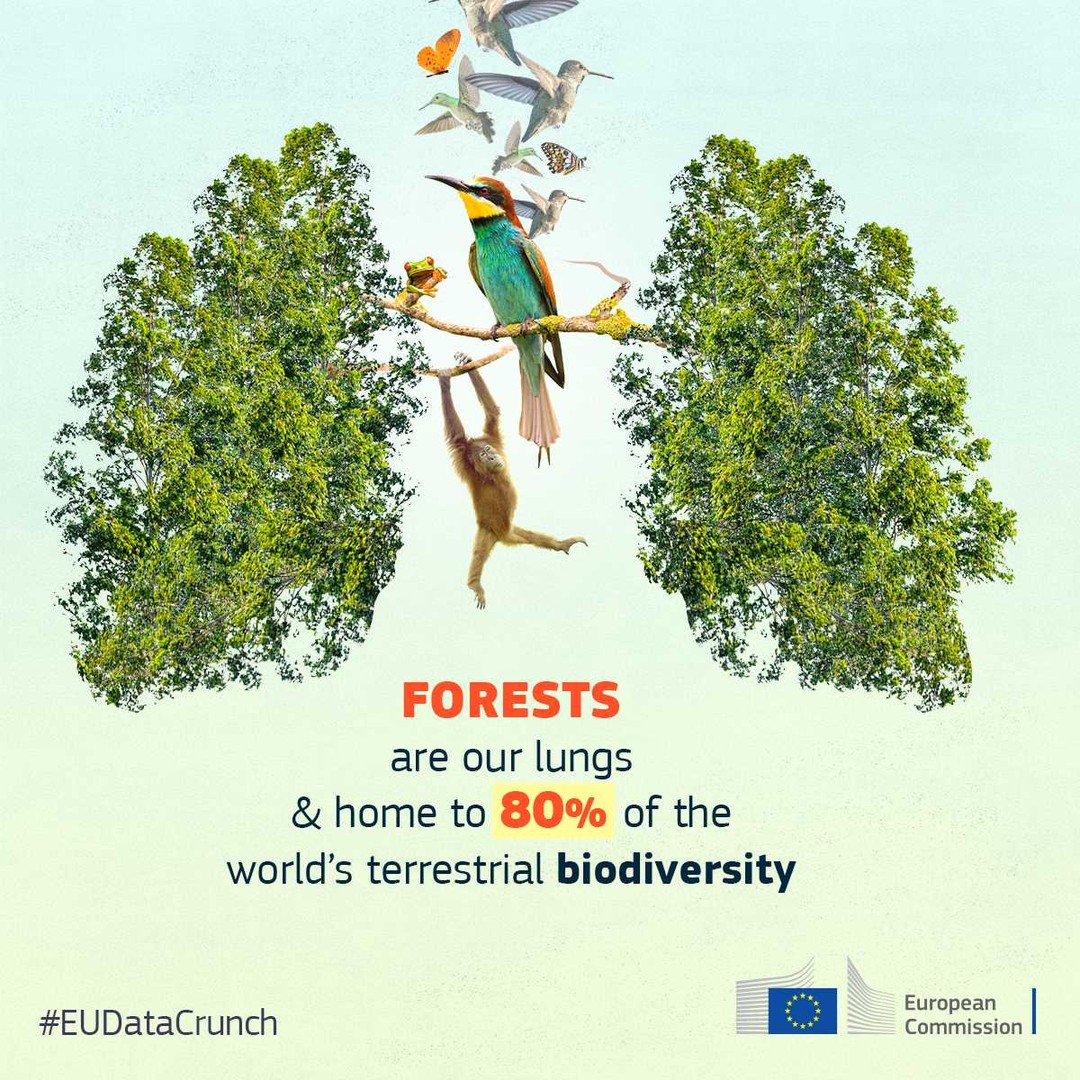
A narrative-led data story translating key biodiversity figures into a more illustrative sequence, with data selected and structured to support the story rather than a conventional data visualisation.
View original postConcept · Design
2021
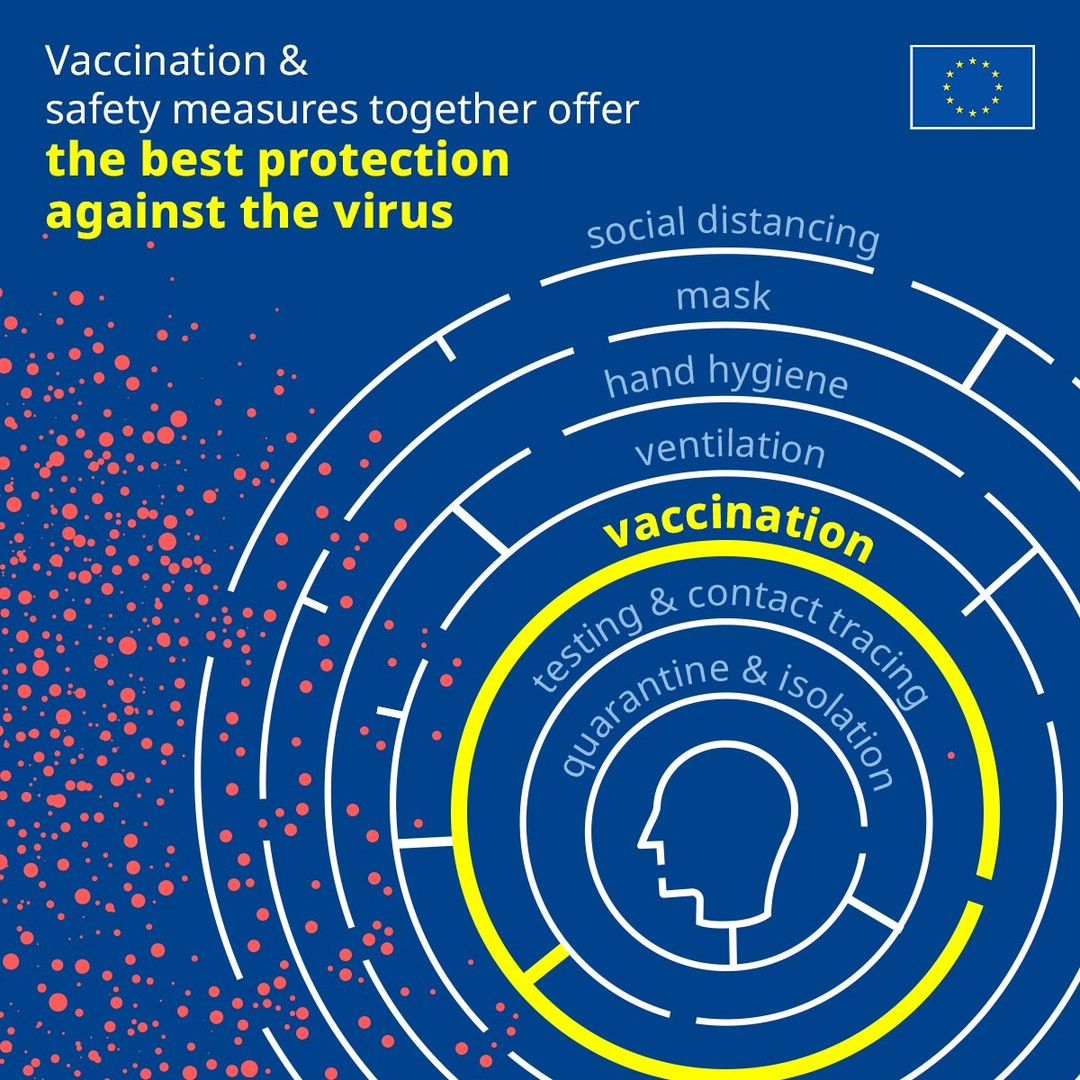
Created during the COVID-19 pandemic, this visual explains how different protective measures work together. Rather than relying on a single action, each layer adds another level of protection — reinforcing the importance of combining everyday precautions to reduce risk.
View original postEUDataCrunch project
Concept · Copy · Data Storytelling · Design
2022
View original postEUDataCrunch project
Concept · Copy · Data Storytelling · Design
2022
View original postEUDataCrunch project
Concept · Copy · Data Storytelling · Design
2022
View original postEUDataCrunch project
Concept · Copy · Data Storytelling · Design
2022
View original post